Demographics
Information
Identity is a core issue at KBtL; we cannot center and hold space for marginalized perspectives without ensuring that the people who work with us are also diverse. KBtL strives to make sure our demographic data is more than just a series of checkboxes. We refine our demographic survey each year. Staff, Volunteers, and Educators are all required to fill out demographic data. For Staff and Educators, we display this data directly on their profile when given permission. In addition, all demographic data for Staff, Volunteers, and Educators from our current year is displayed anonymously in aggregate on our Identities page, allowing us to display a snapshot of the places we come from as a conference. Since Staff, Volunteers, and Educators represent the organization, our Identities page is an important way of reflecting on who leads and fuels this conference and what marginalized identities they hold.
Demographics also apply to our attendees, though, and our Identities page does not list attendee information, nor does it reflect the percentages or amounts of various identities. Which is why we have included the following information from the past year(s) of Kink Between the Lines on this page. The data below represents all people who filled out a demographic form - attendees, staff, volunteers, and educators - if they consented to having their data displayed publicly.
Data from 2024
Overview
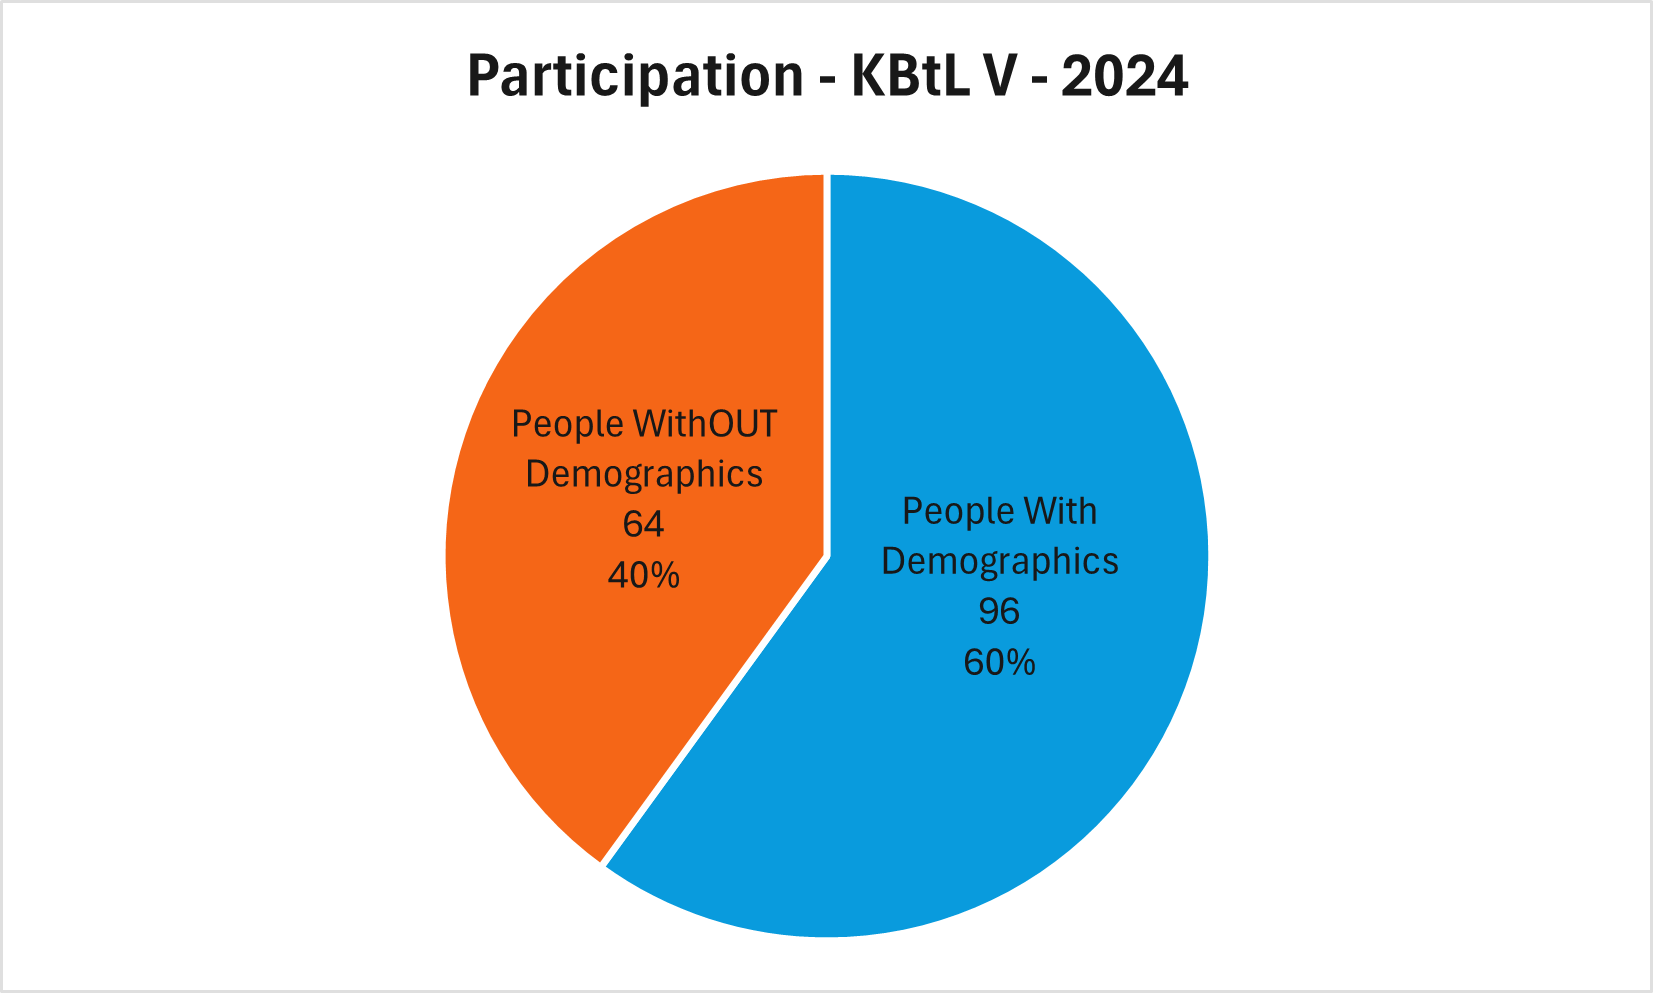
Participation
Pie chart of how many people filled out demographics vs how many attended the conference.
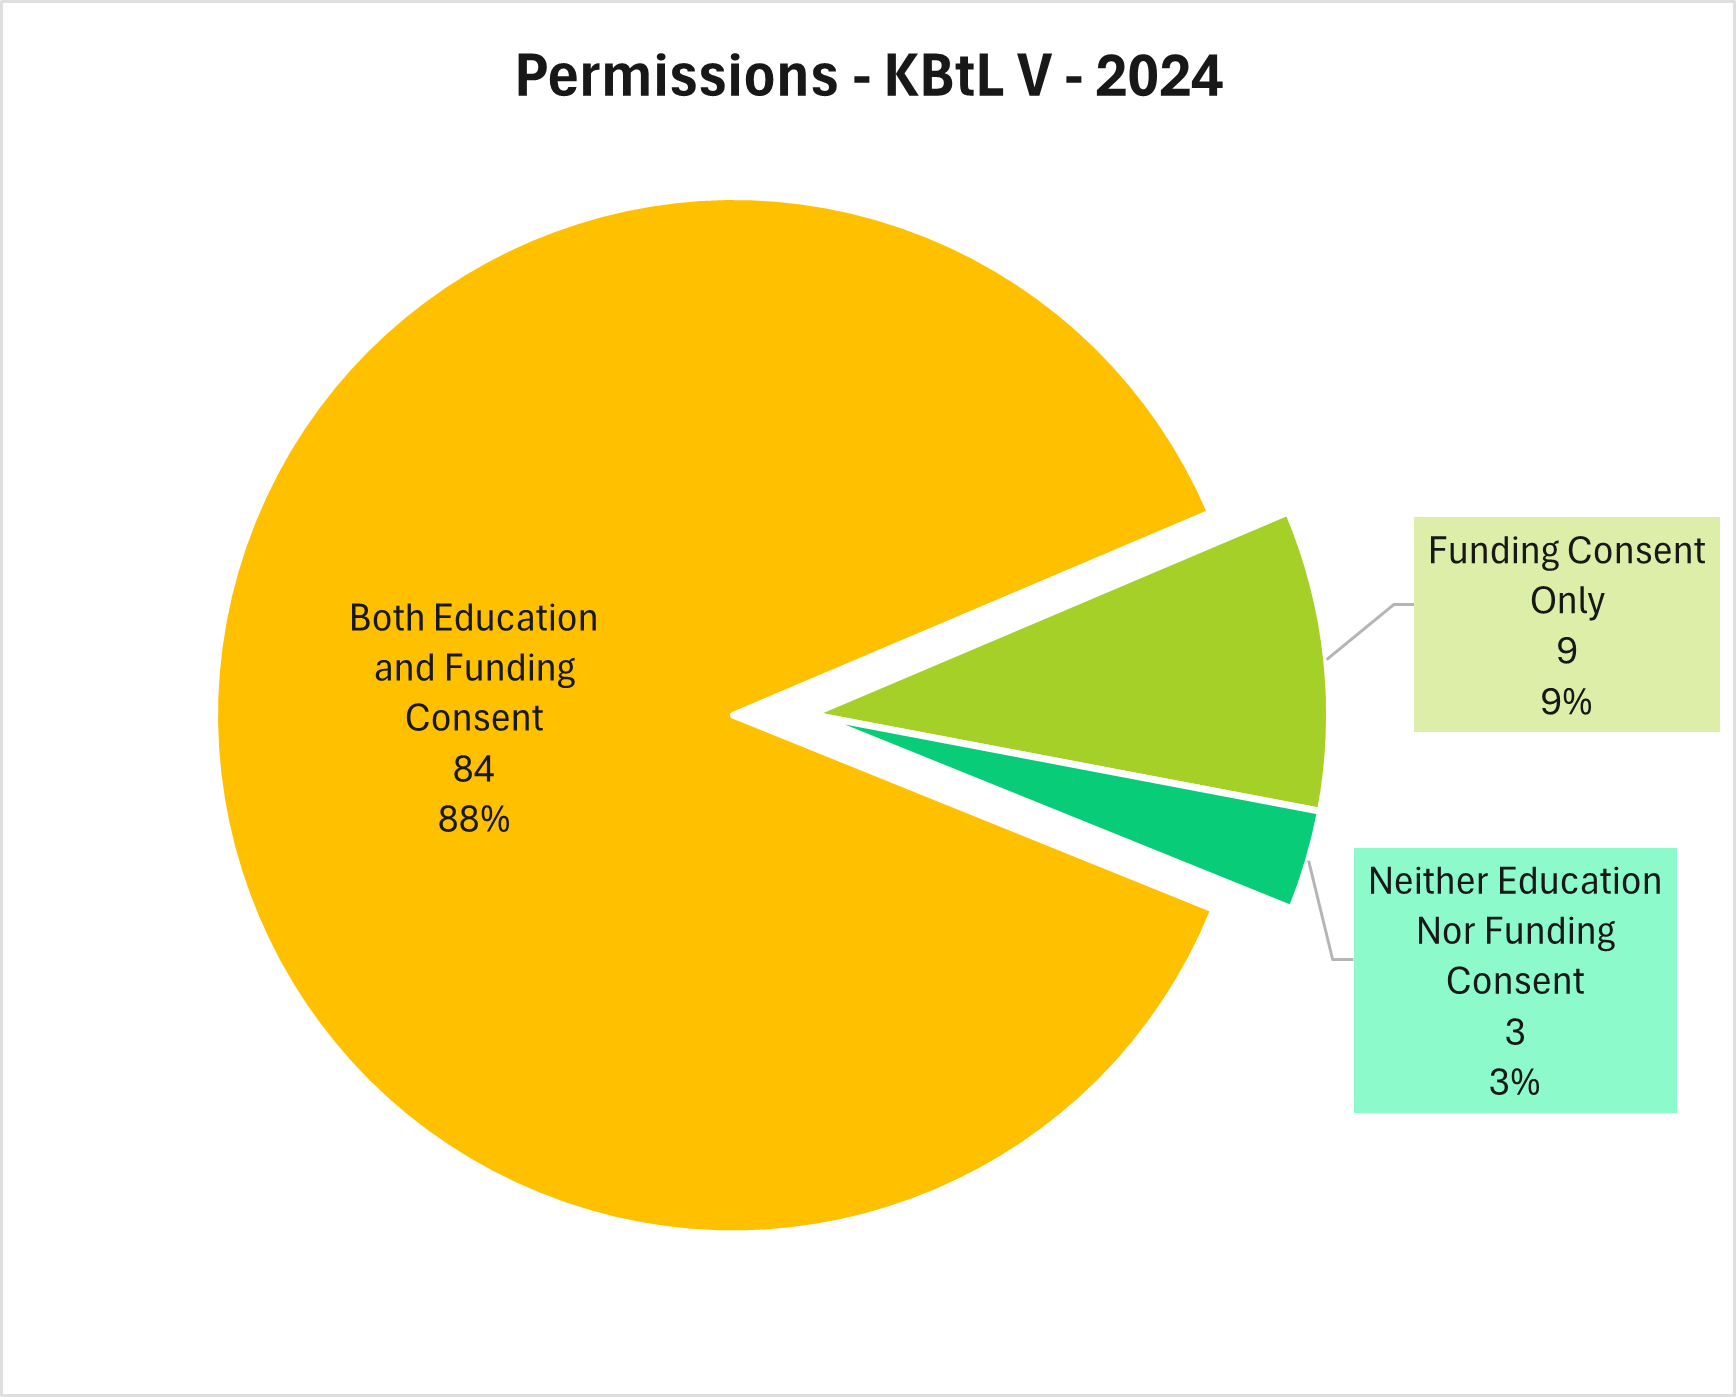
Permissions
How many people gave us consent to use their demographic data in certain ways.
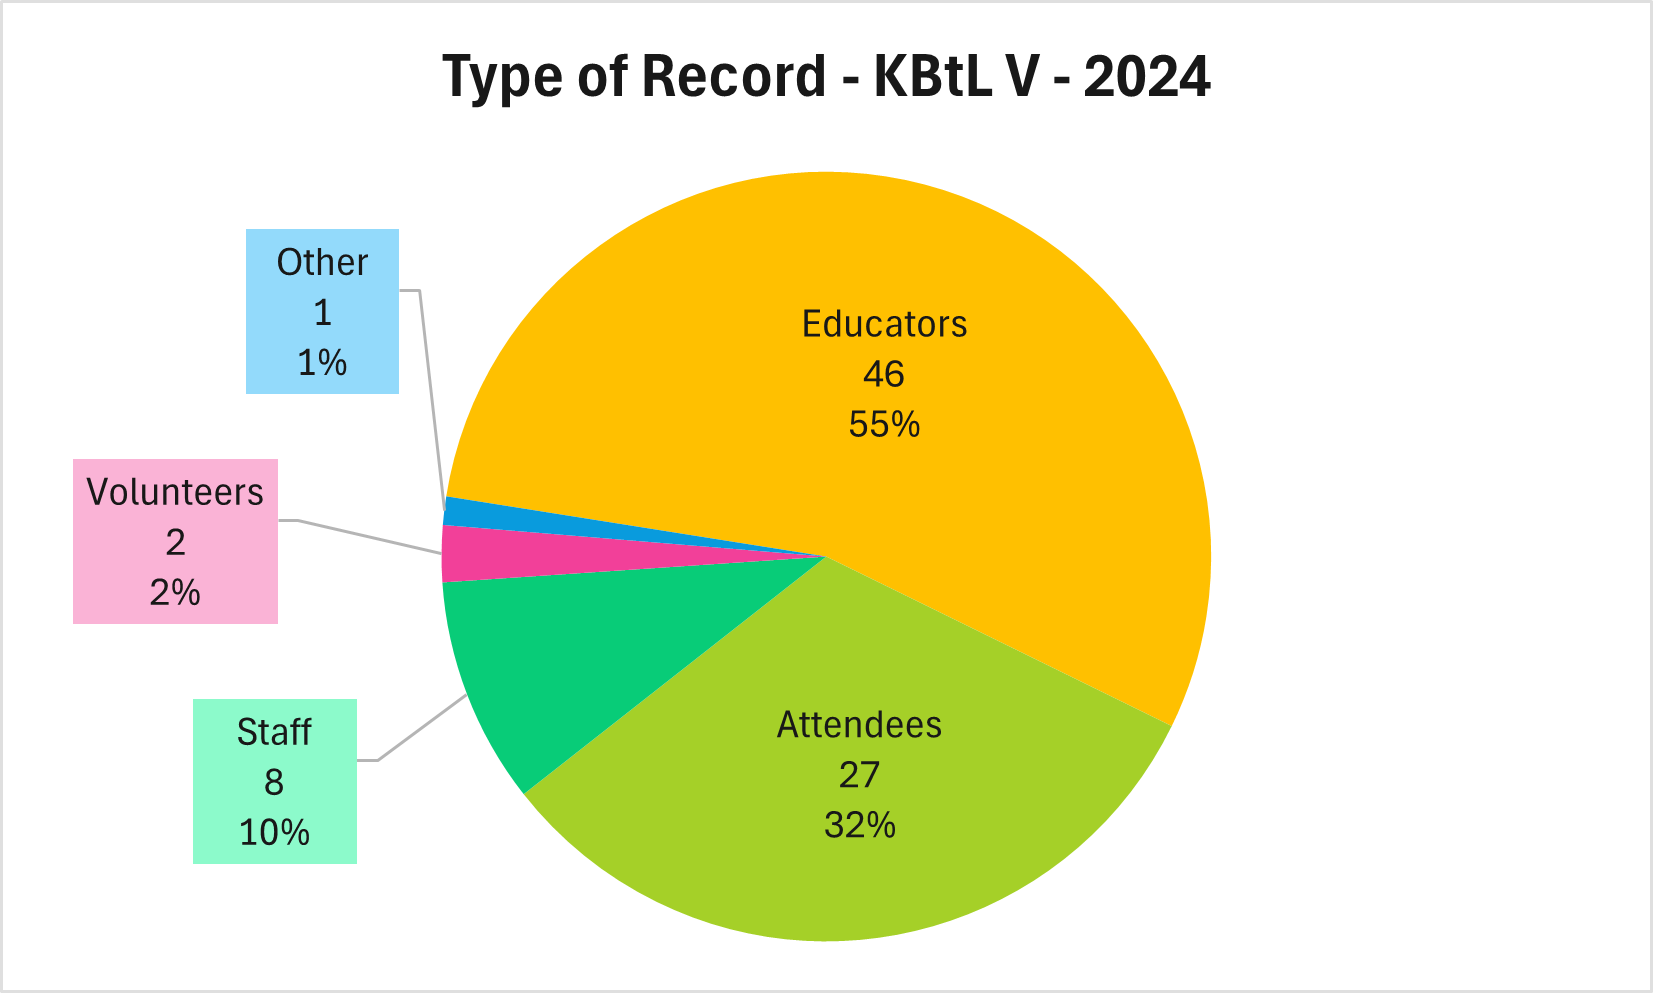
Record Types
Of the 84 demographic records that gave educational consent, which number came from attendees, educators, staff, or volunteers?
Race & Ethnicity Data
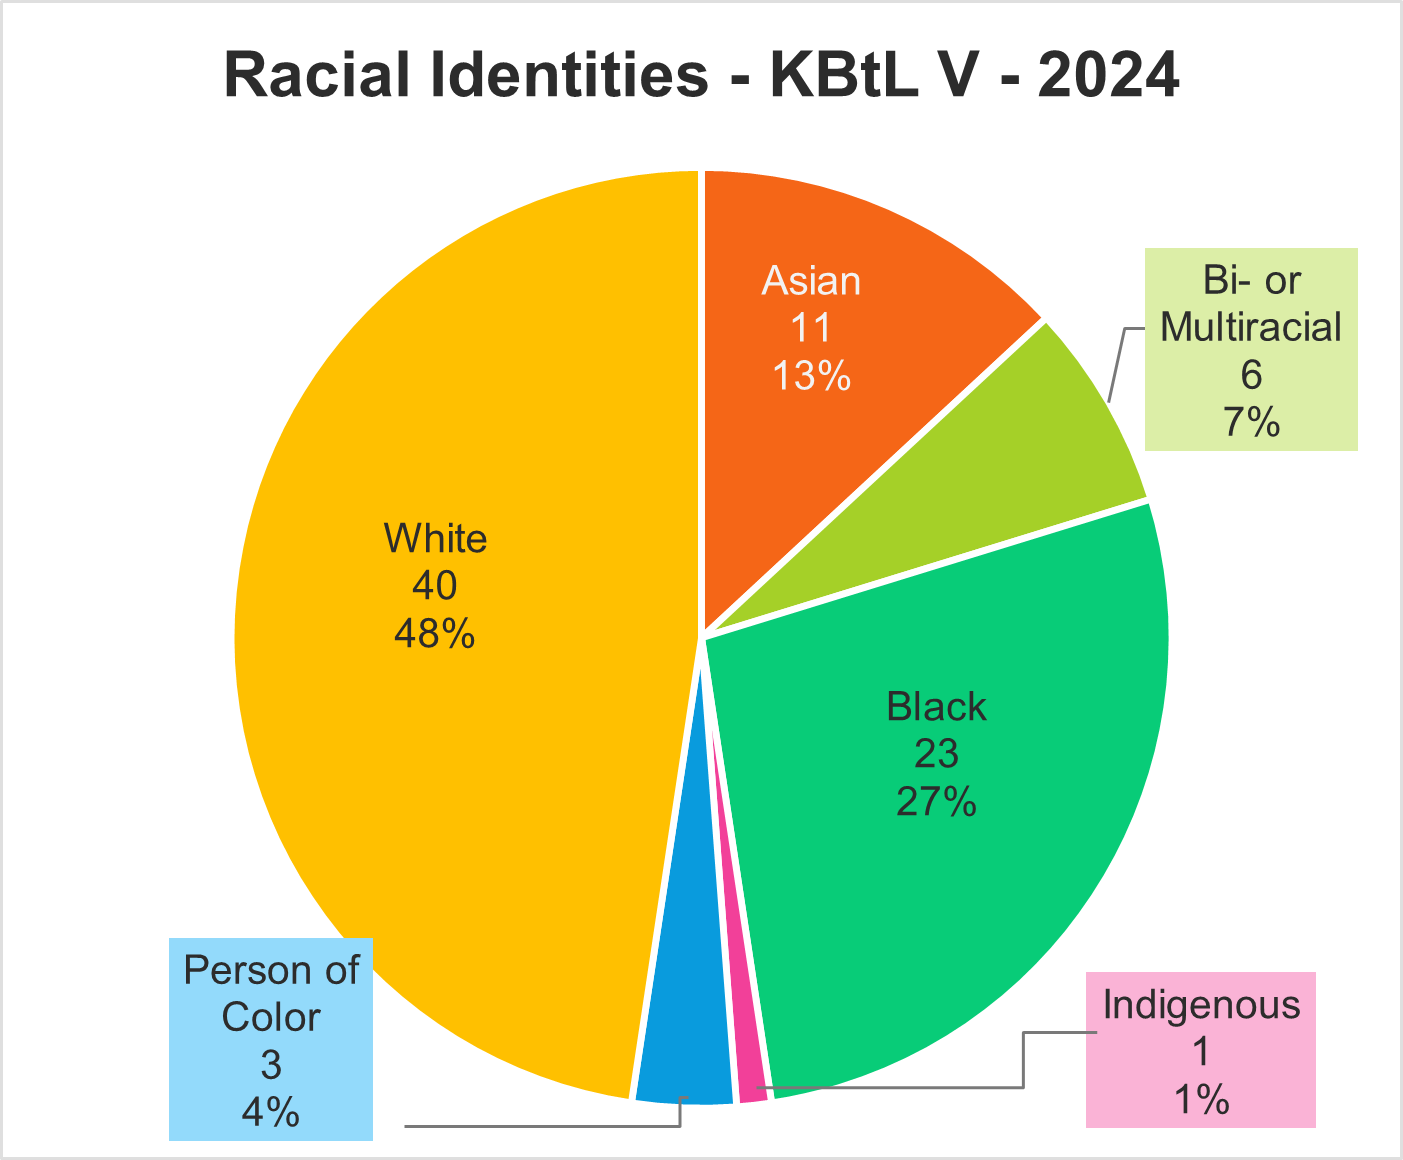
Racial Identities
How people identified their race.
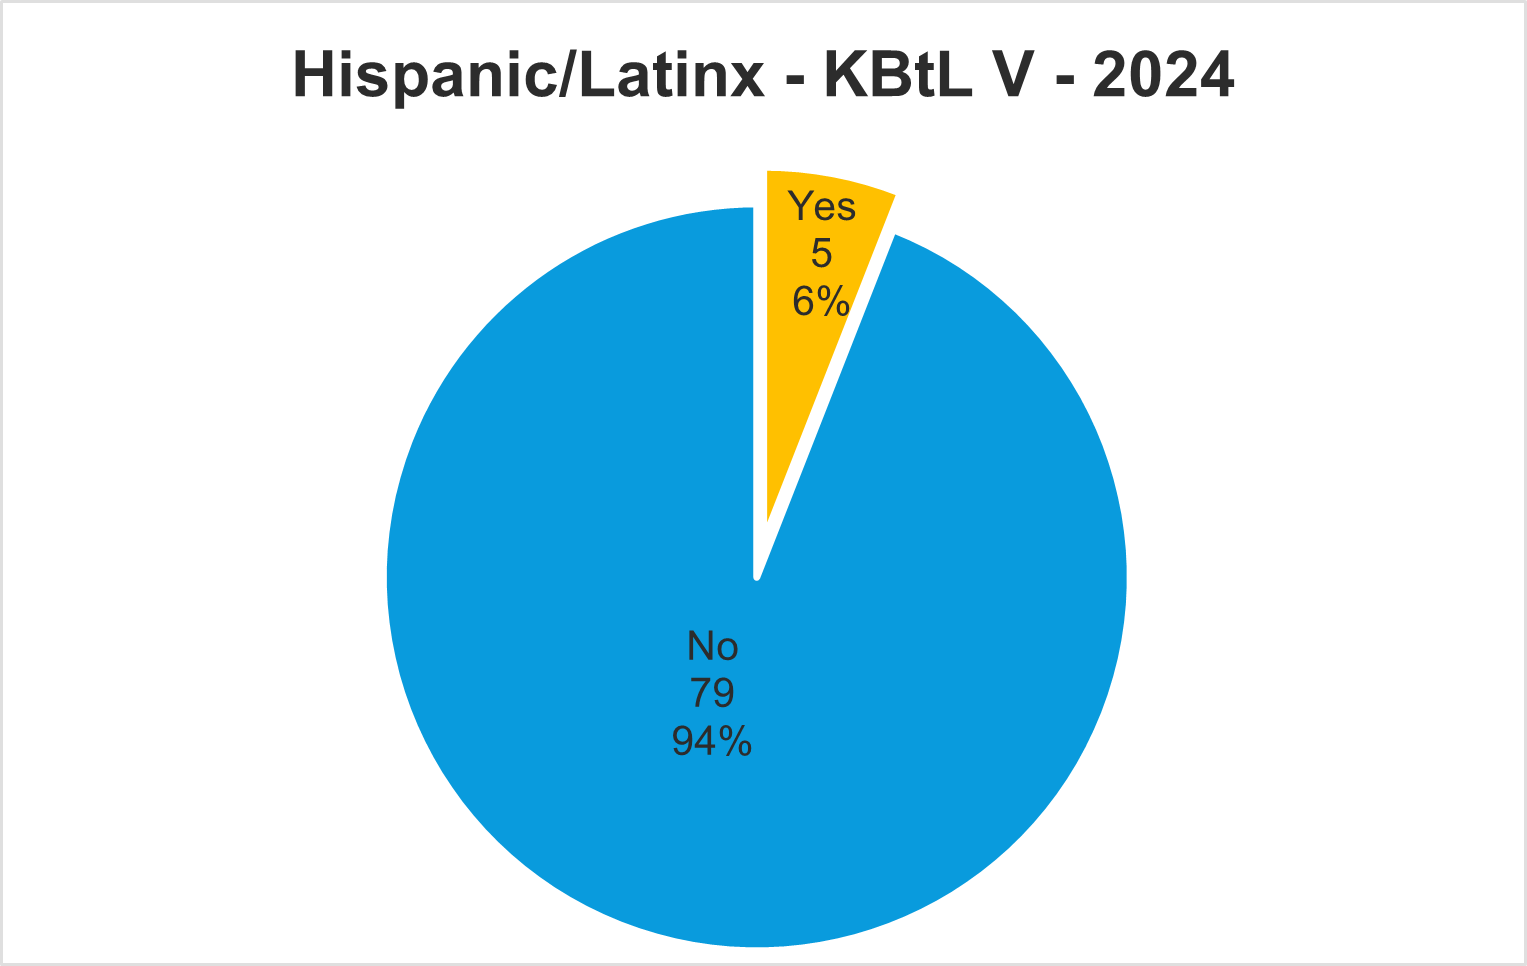
Hispanic/Latinx Identification
Whether or not people identified themselves as Hispanic, Latino, Latina, or Latinx.
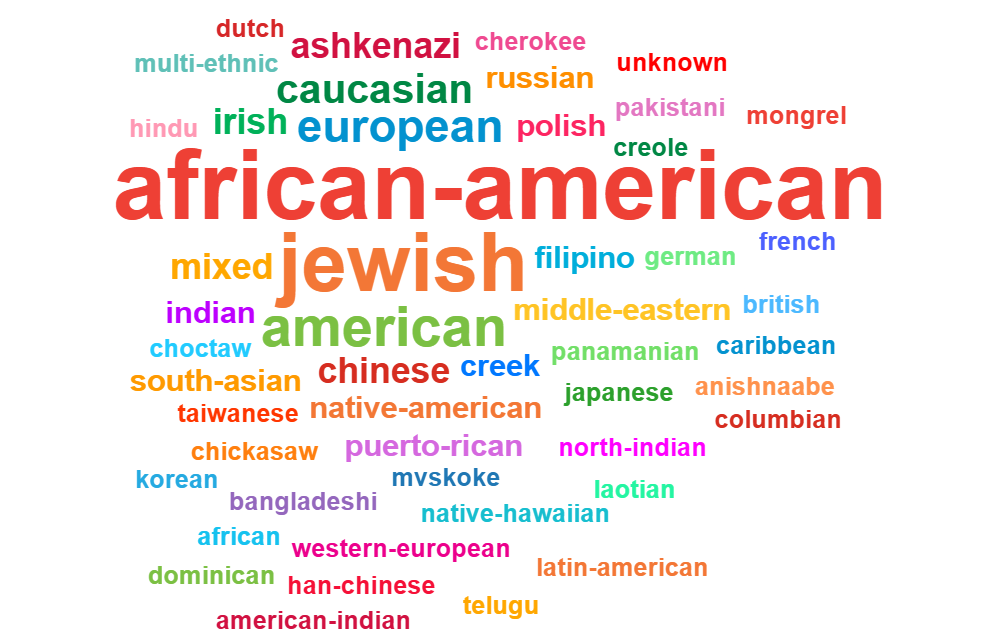
Ethnic Identities
A word cloud of all the various terms people used to describe their ethnicity. Larger words indicate they were used more often than smaller words.
Geographical Data
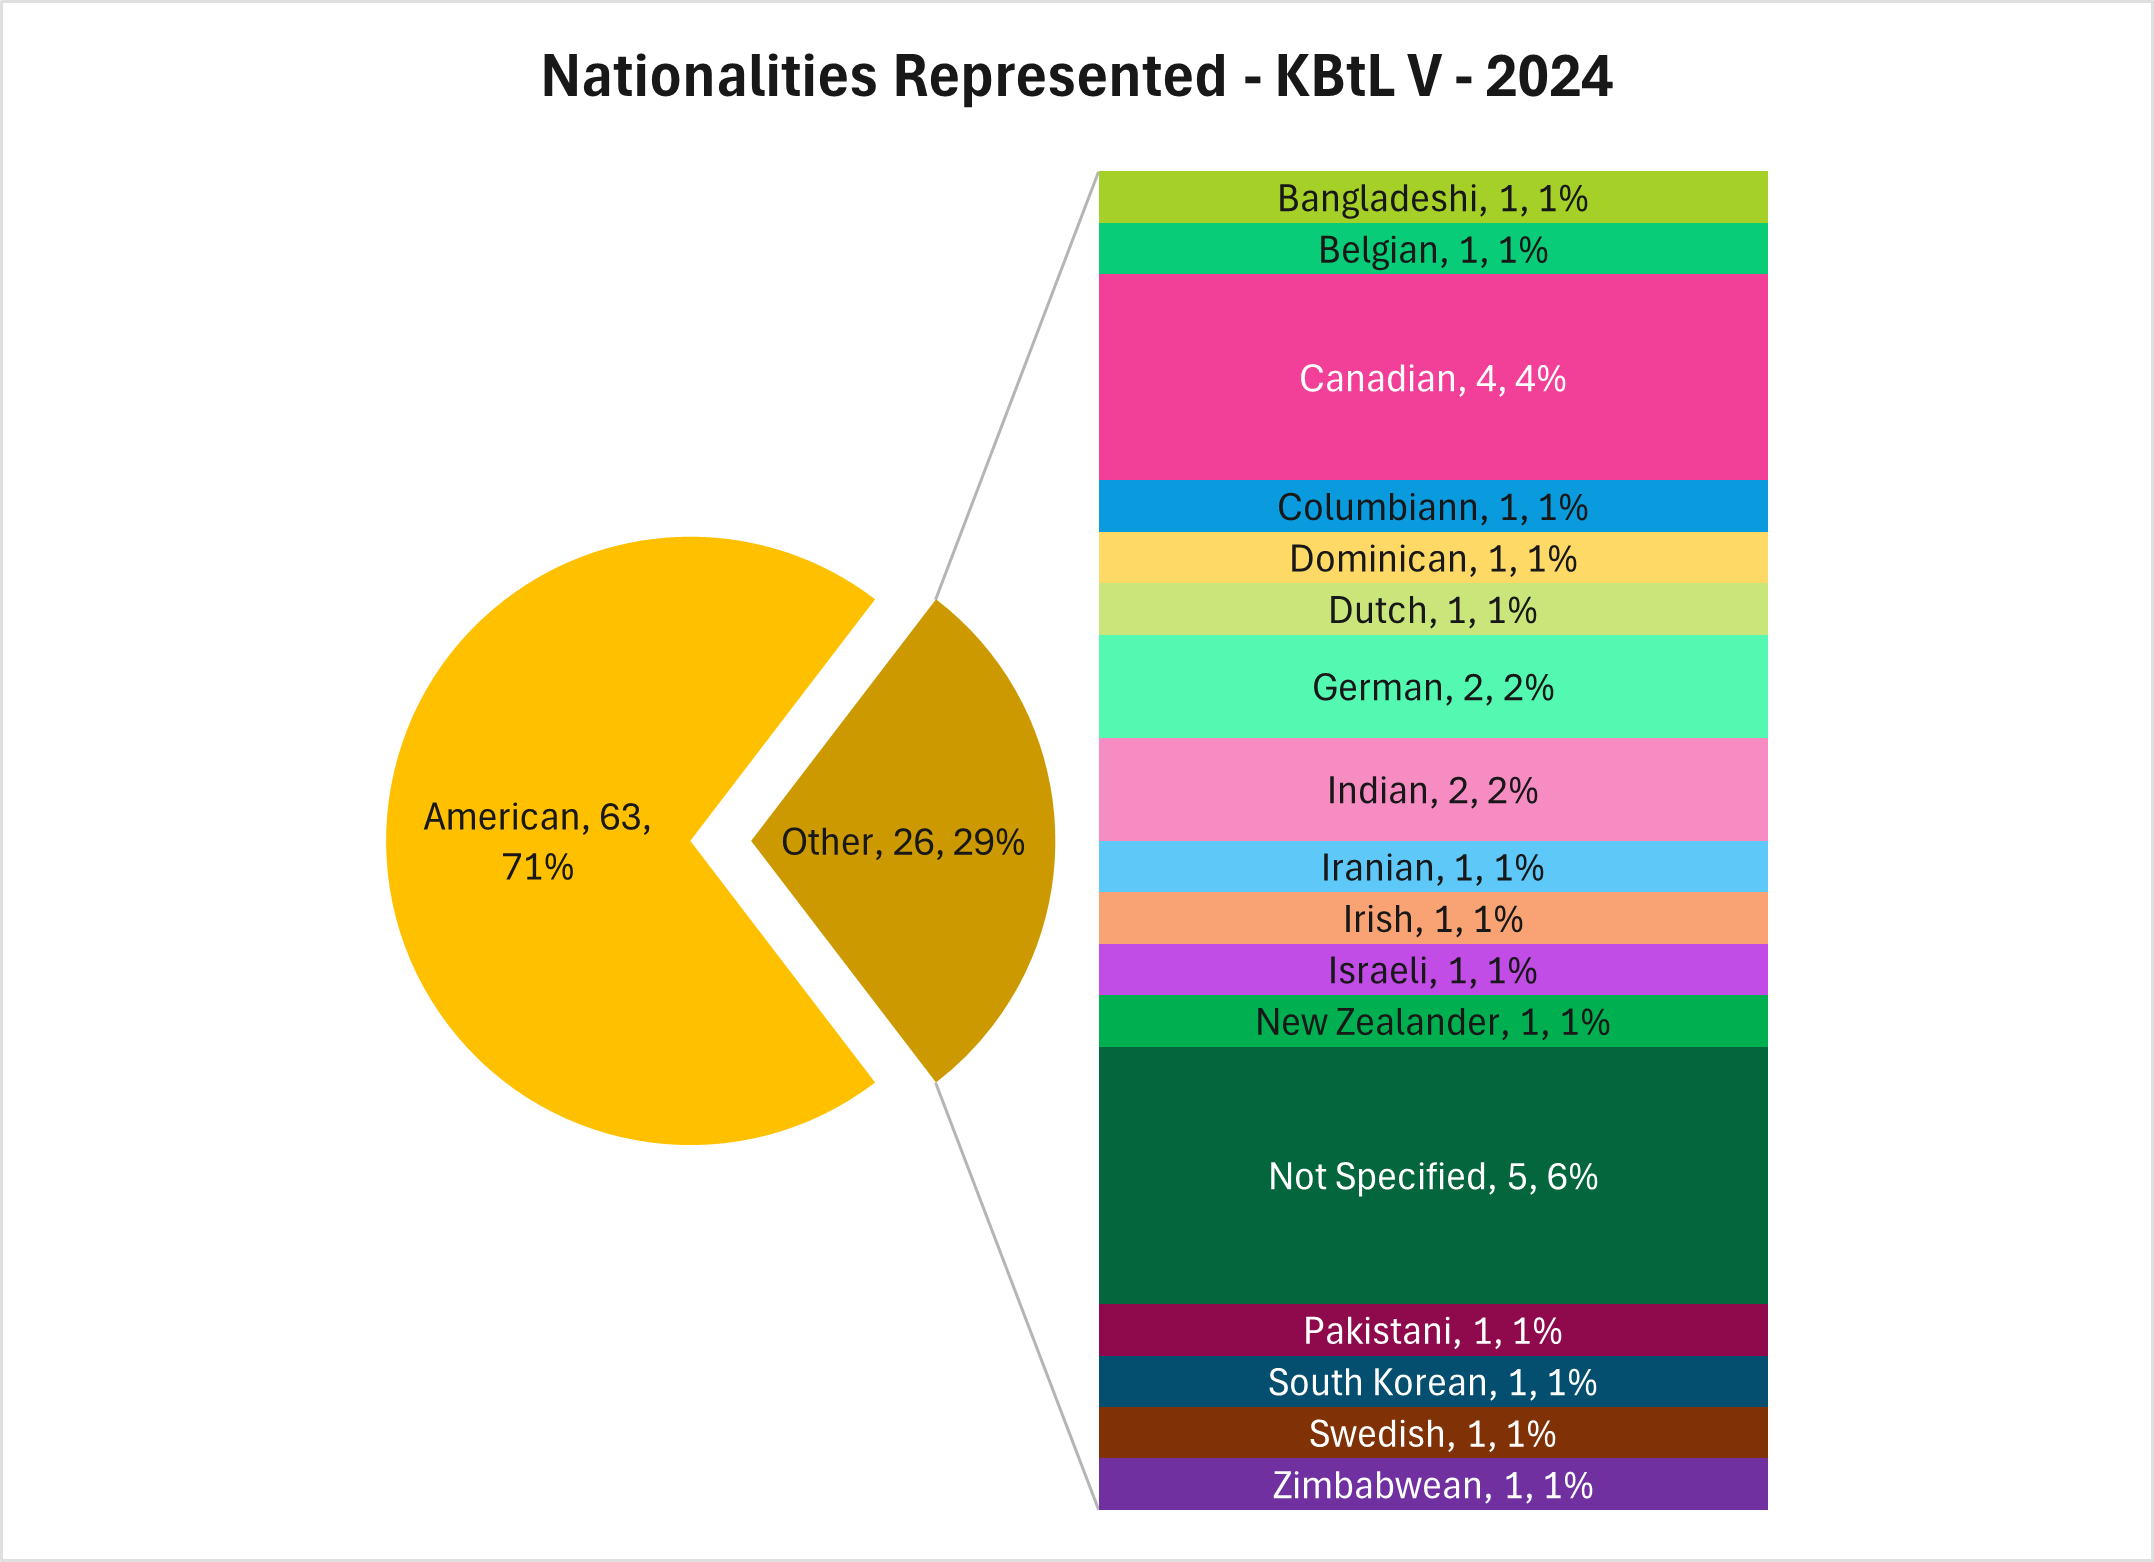
Nationalities
How people identified their Nationality (aka the country/countries of their citizenship). Please keep in mind that people can hold dual or multi citizenship.
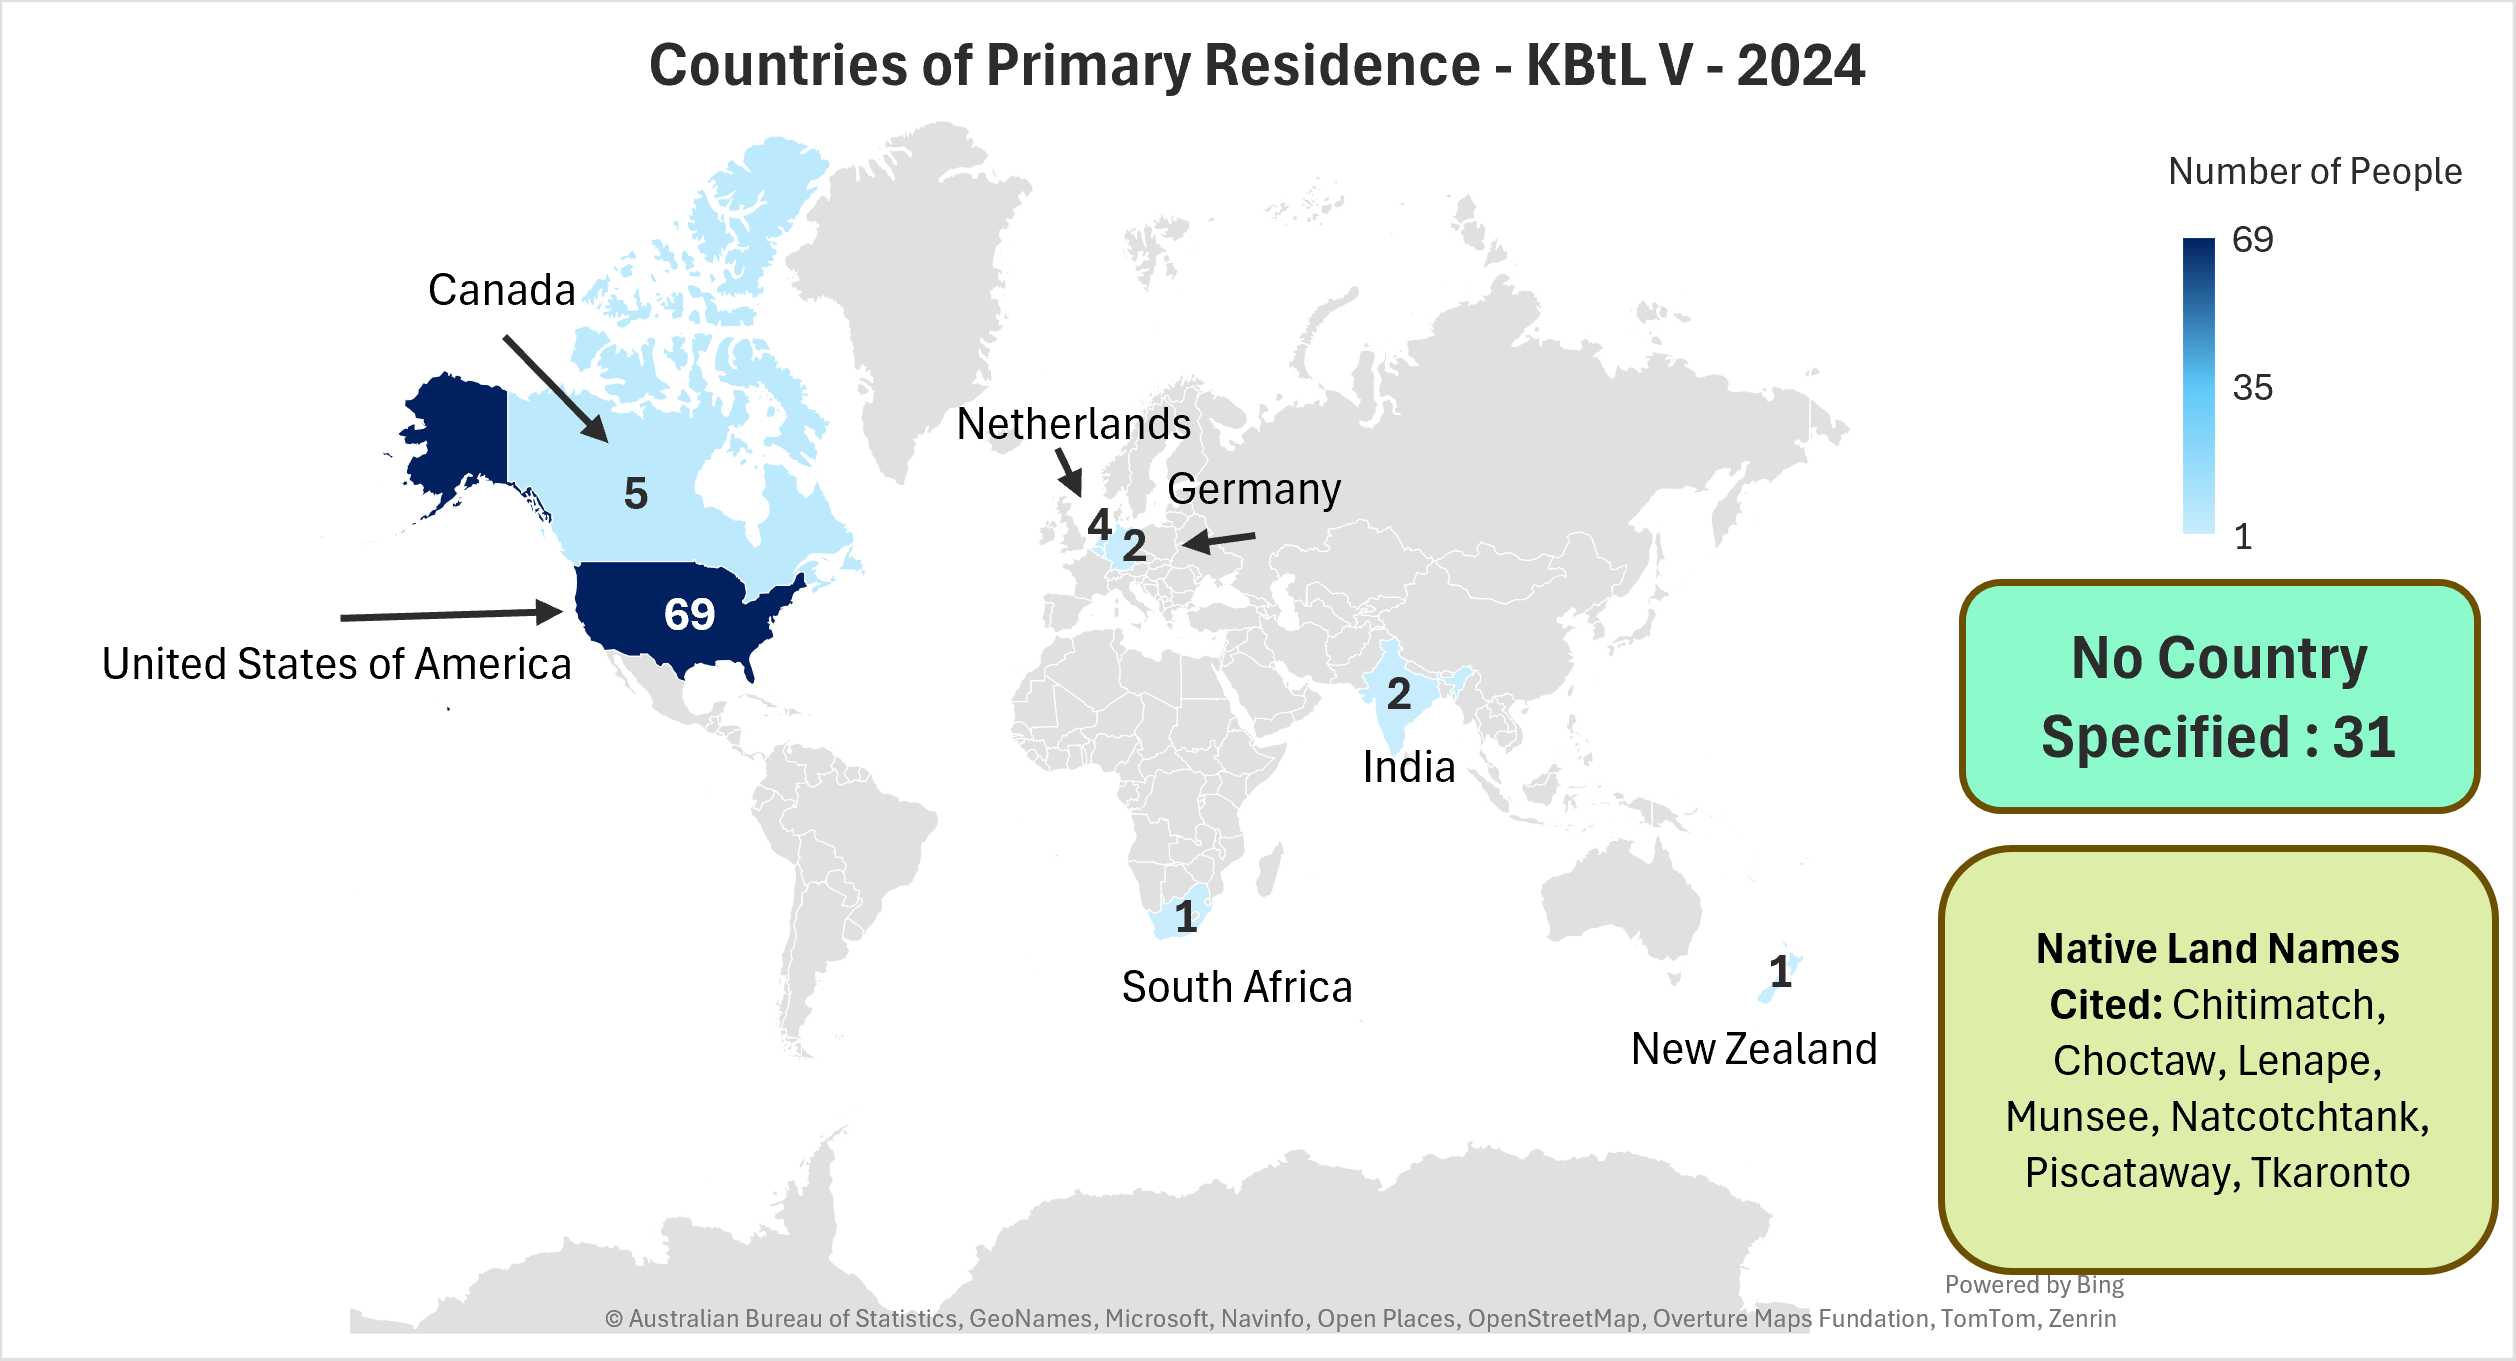
Residence Countries
A map of all the countries that people listed as being residents of (aka the country they lived all or most of the year).
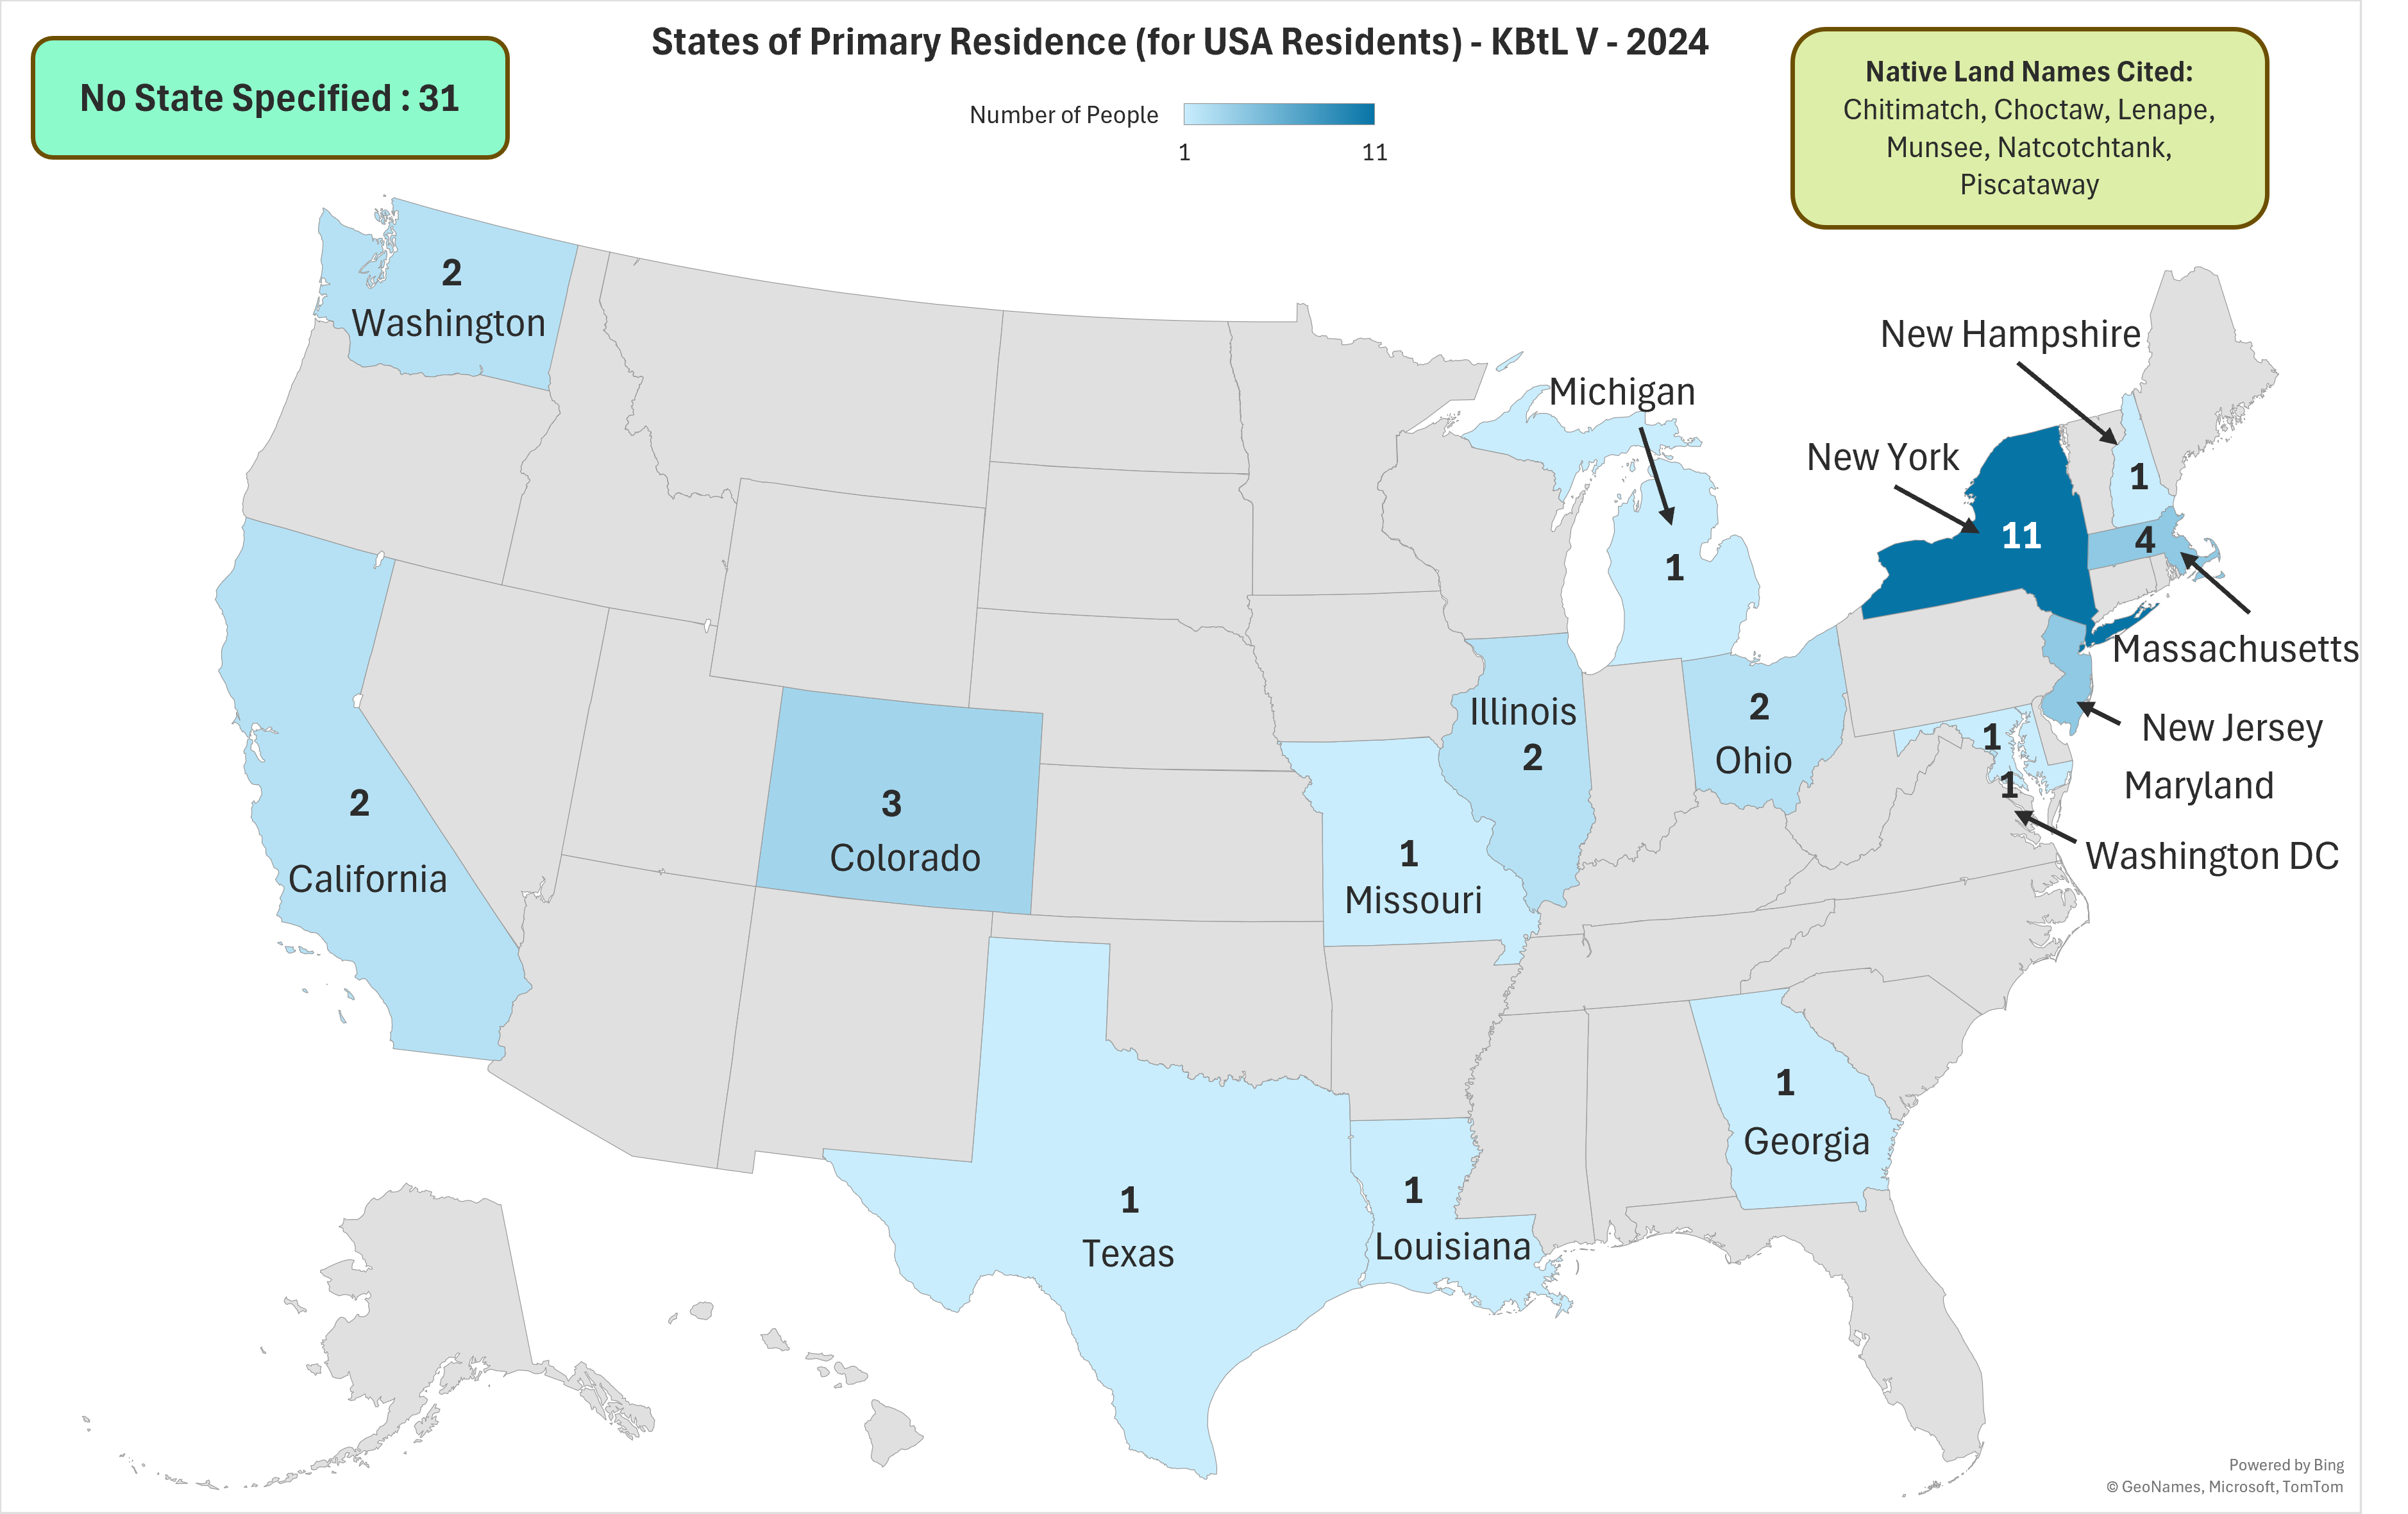
Residence States
For those who identified their country of residence as the USA, this map displays which states they listed as residing in.
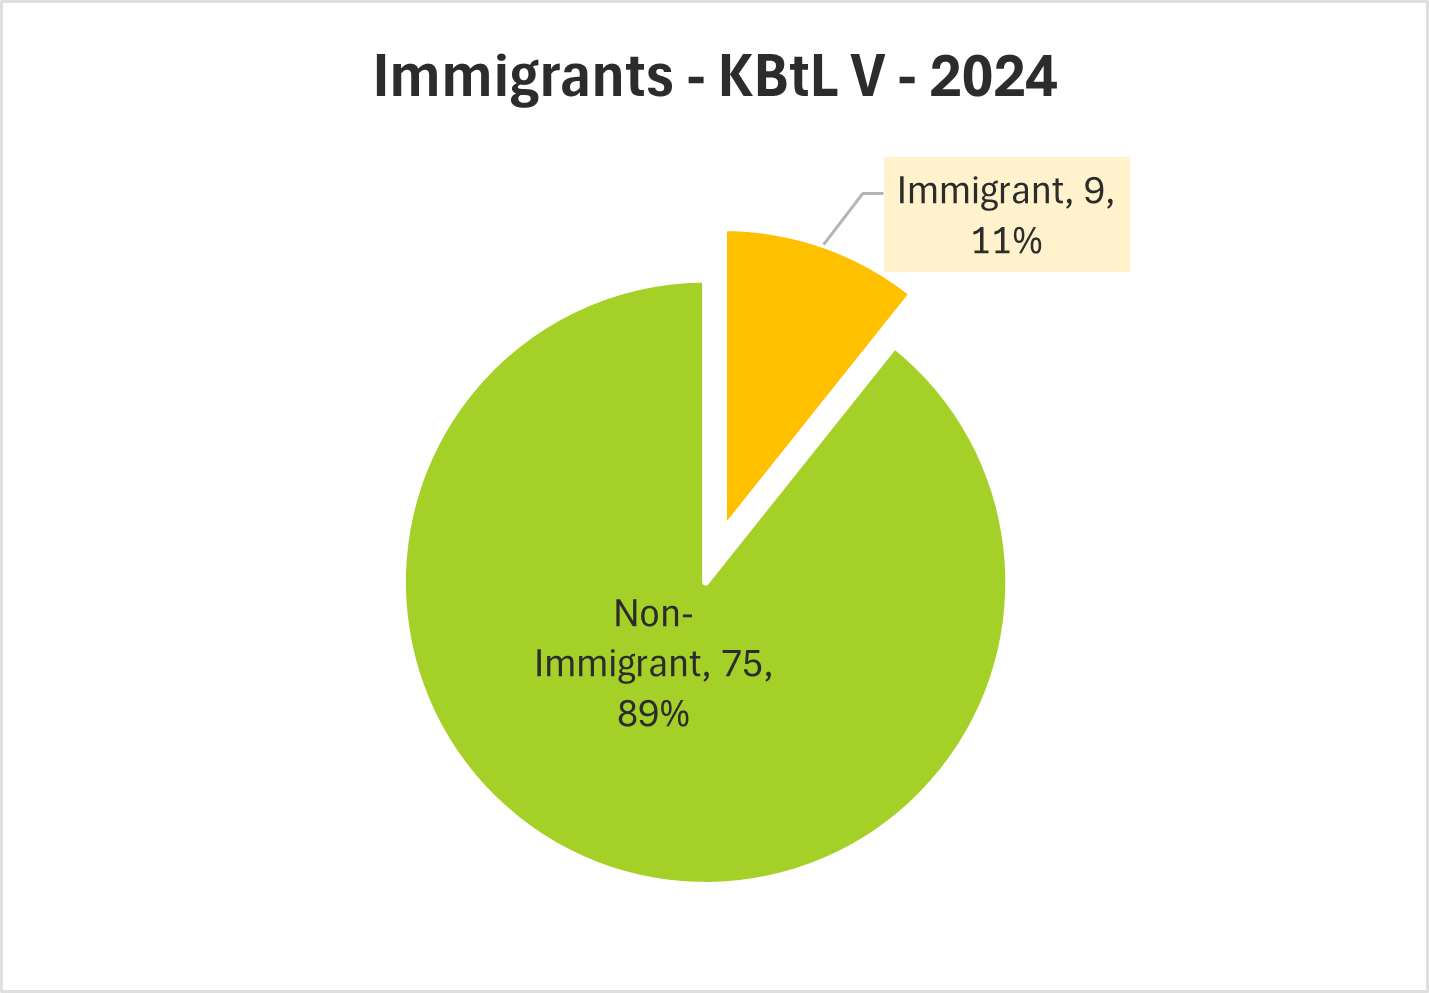
Immigrant Identification
A pie chart depicting how many people self identified as immigrants.
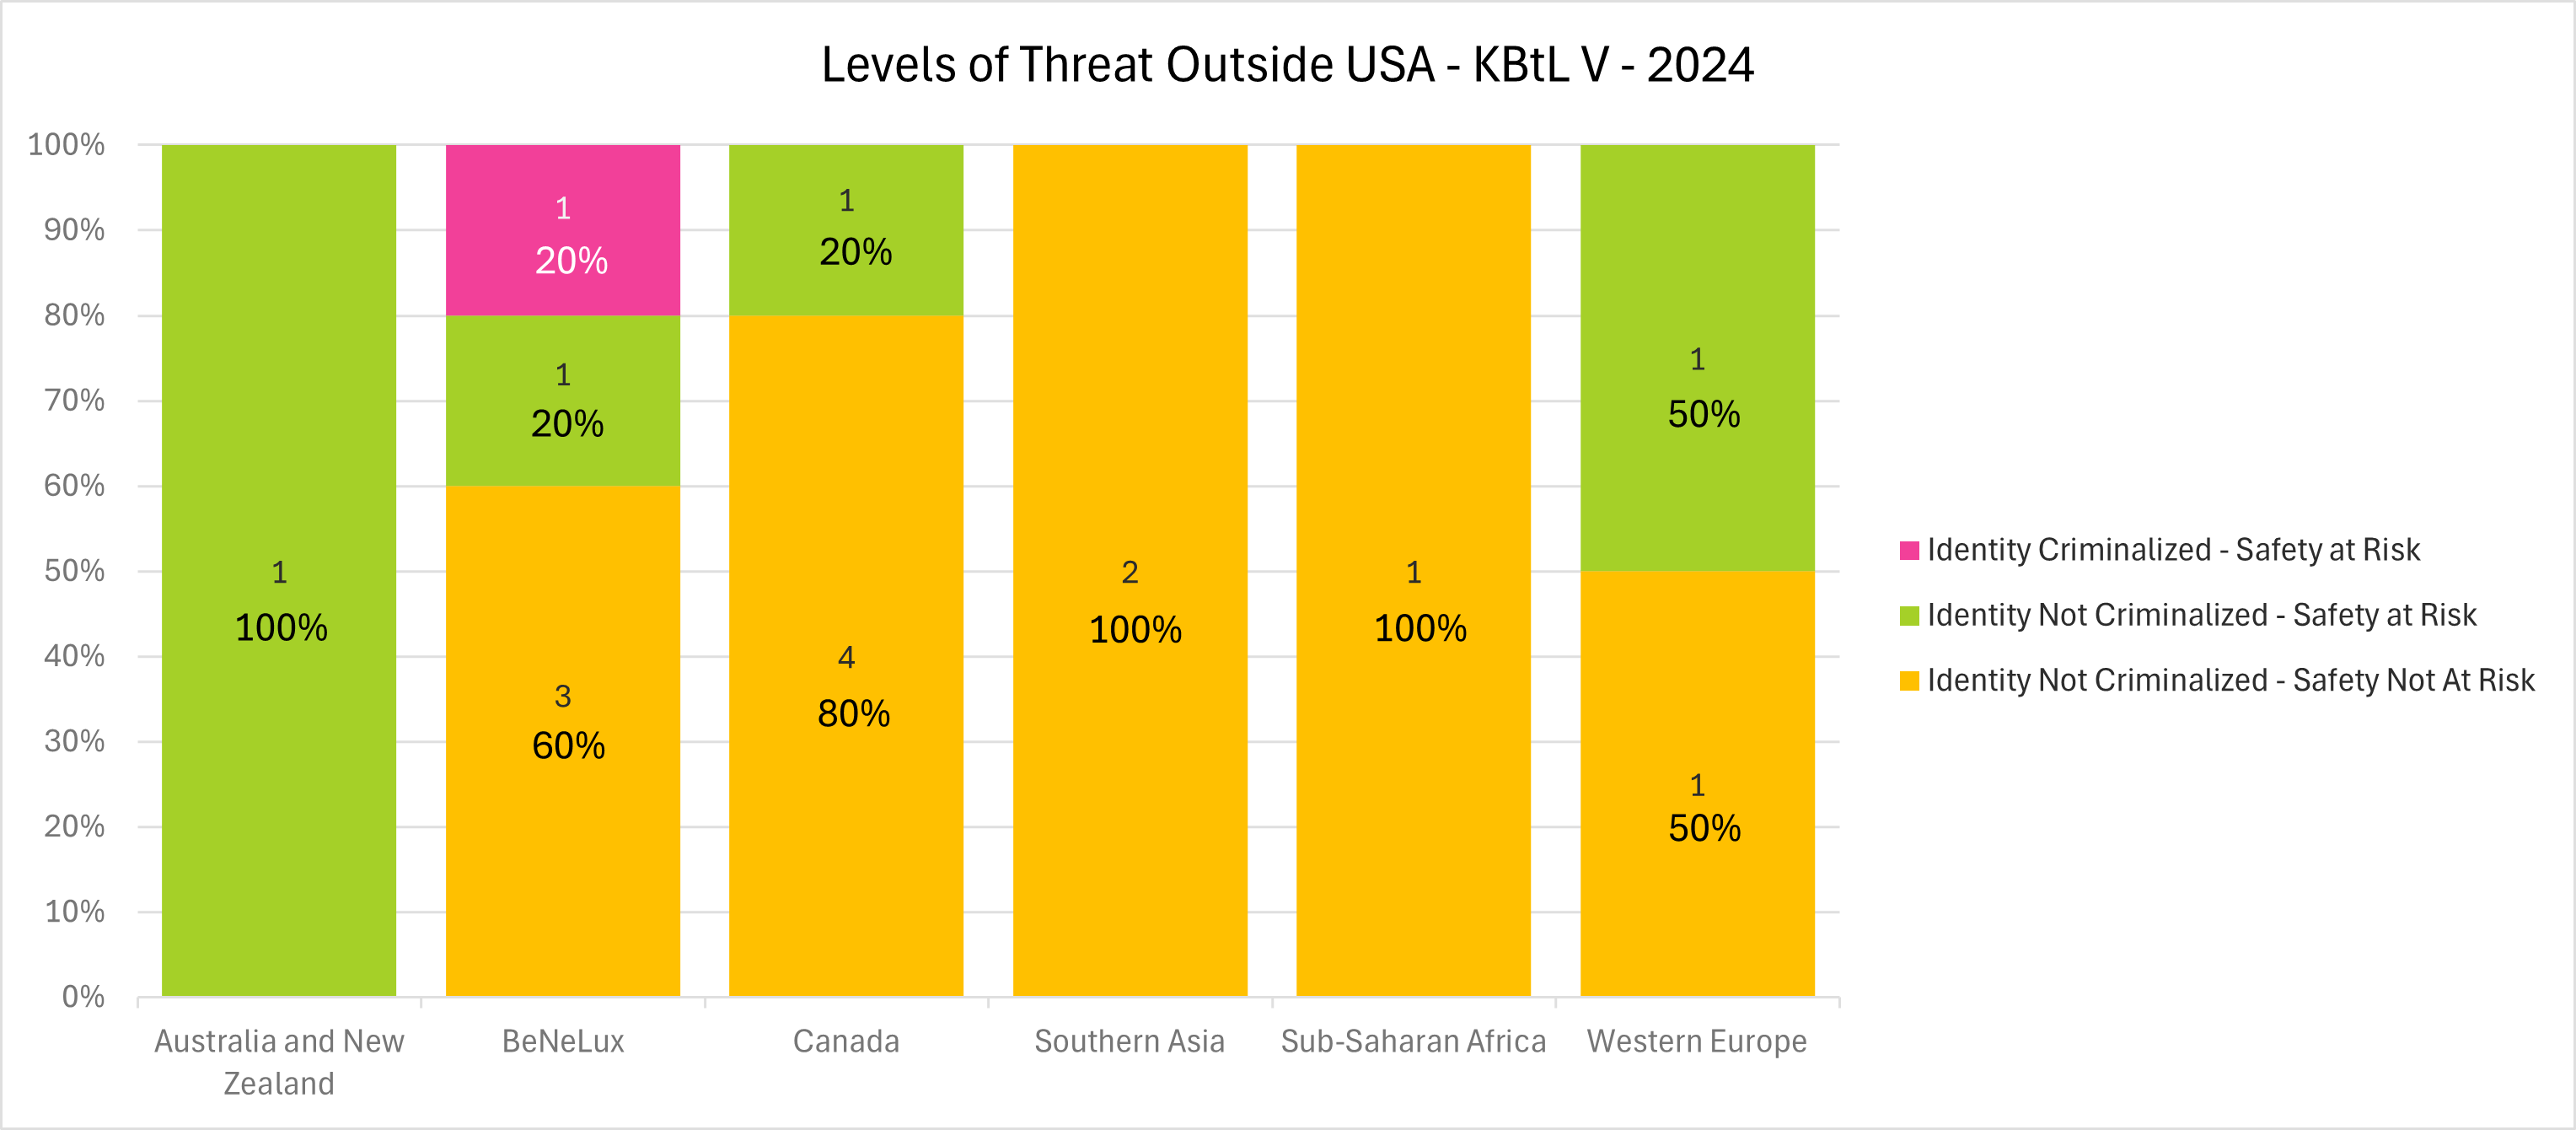
Threats Outside USA
A chart depicting how many people from countries outside the USA stated that one or more of their identities had been criminalized by their government and/or that they felt their safety was at risk because of one or more of their identities.
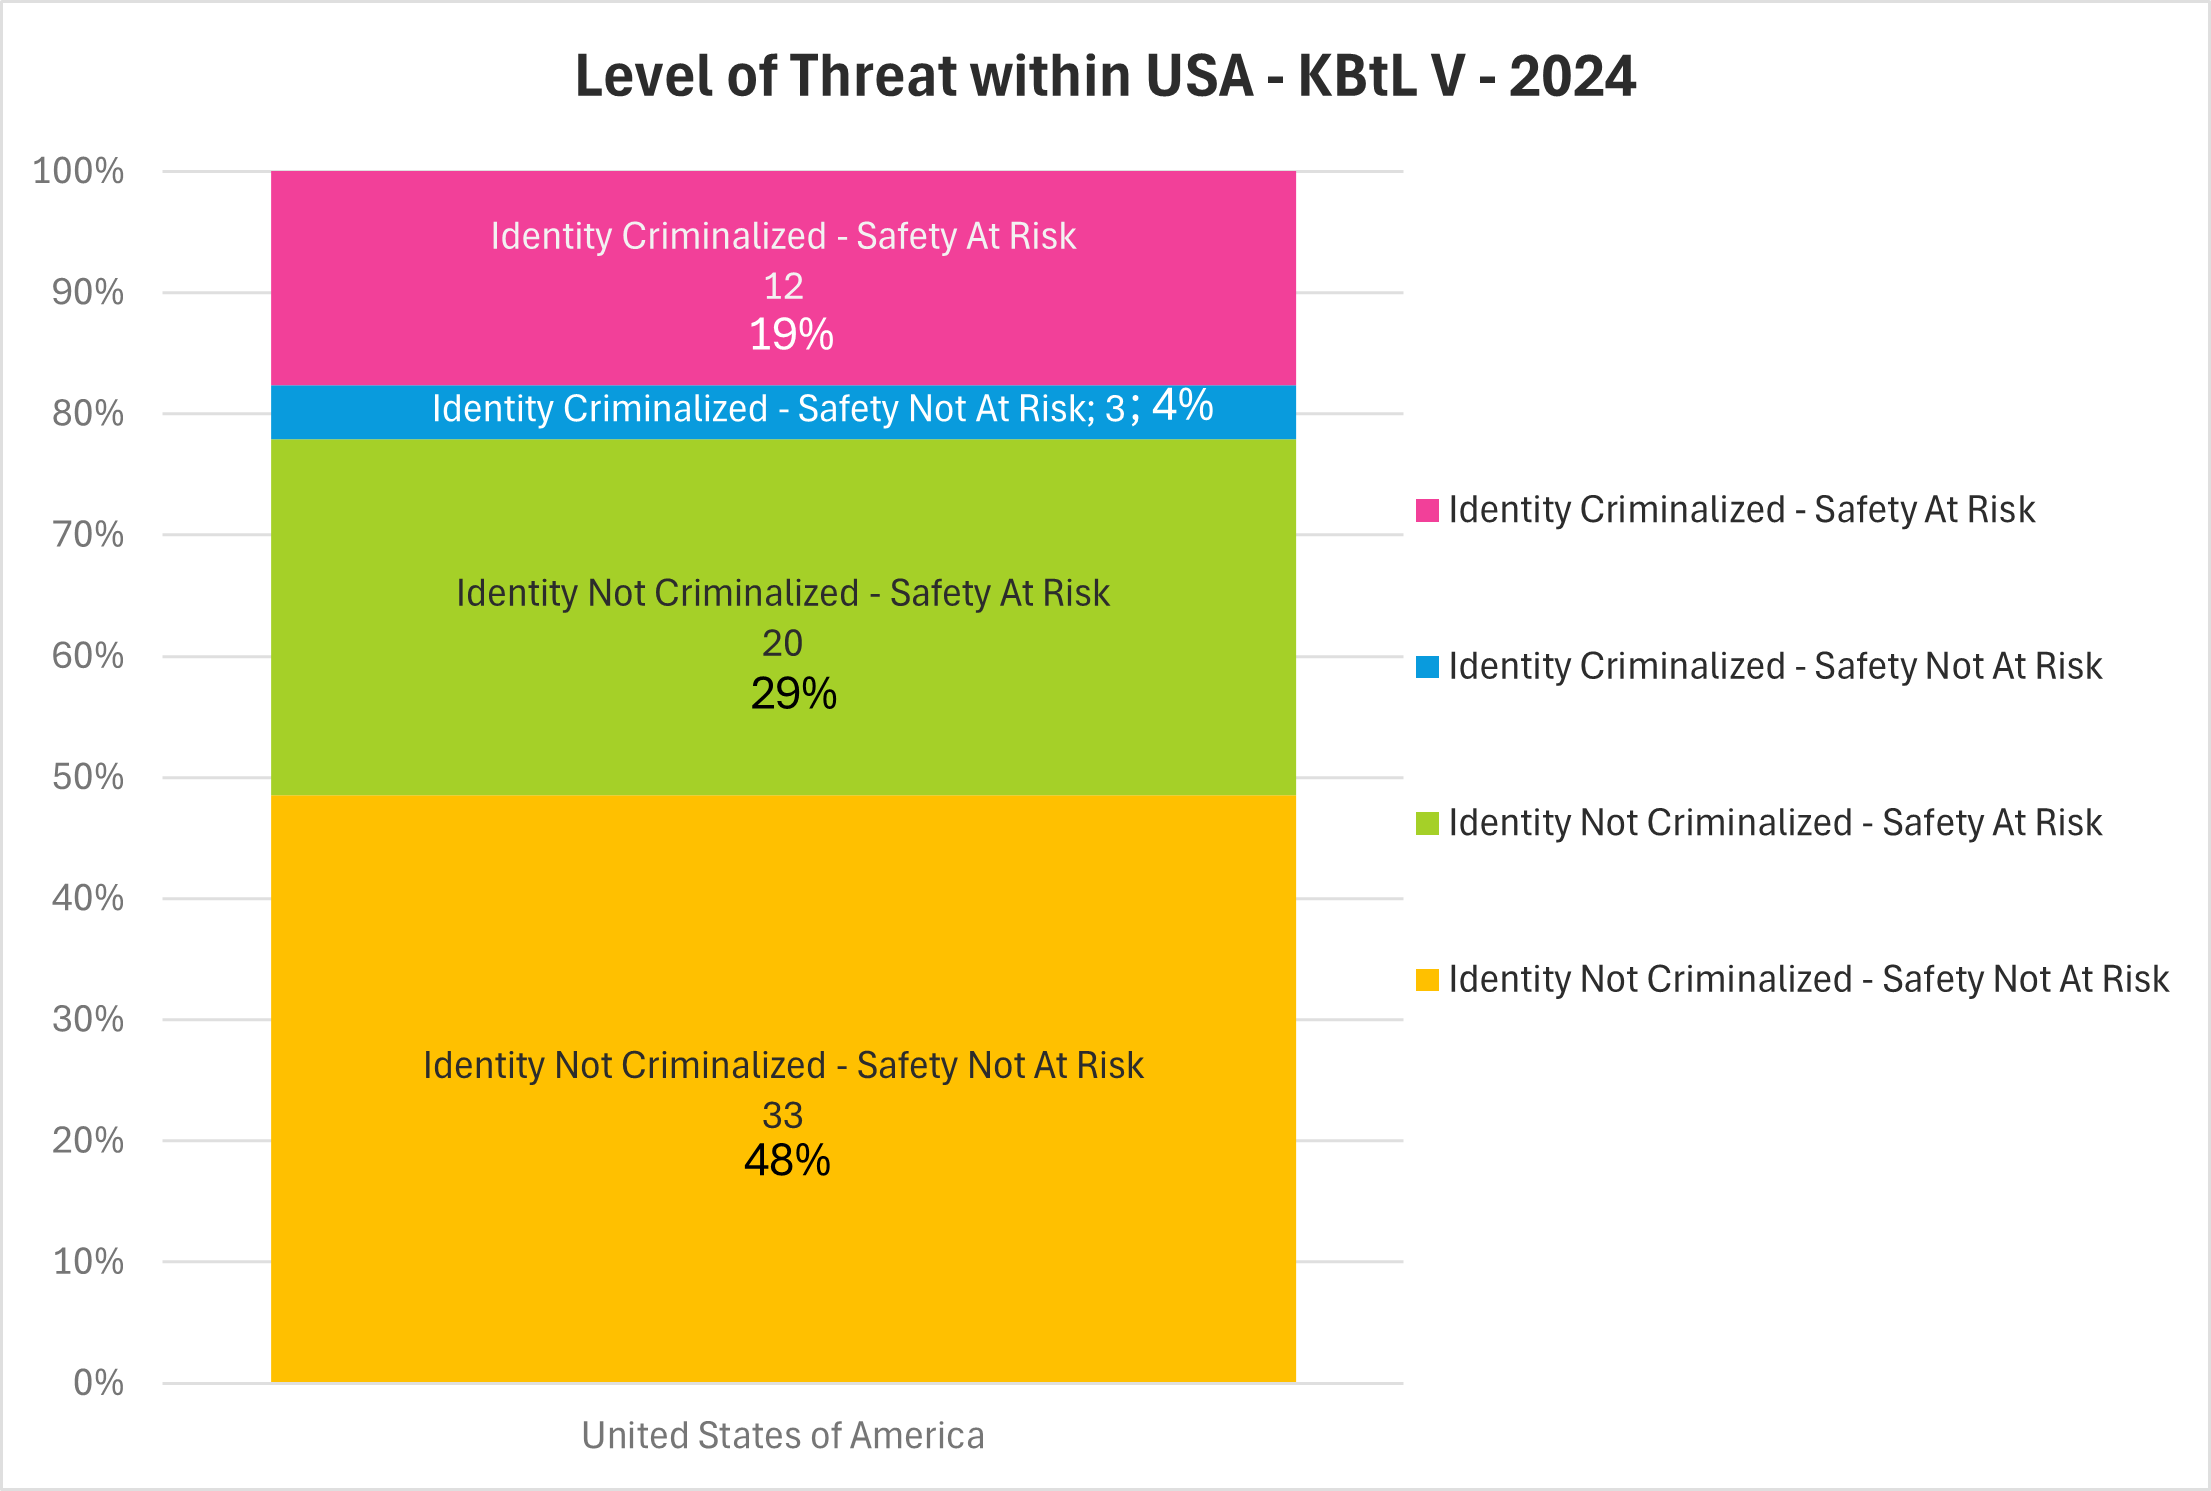
Threats Inside USA
A chart depicting how many people from the USA stated that one or more of their identities had been criminalized by their government and/or that they felt their safety was at risk because of one or more of their identities.
Age & Family Data
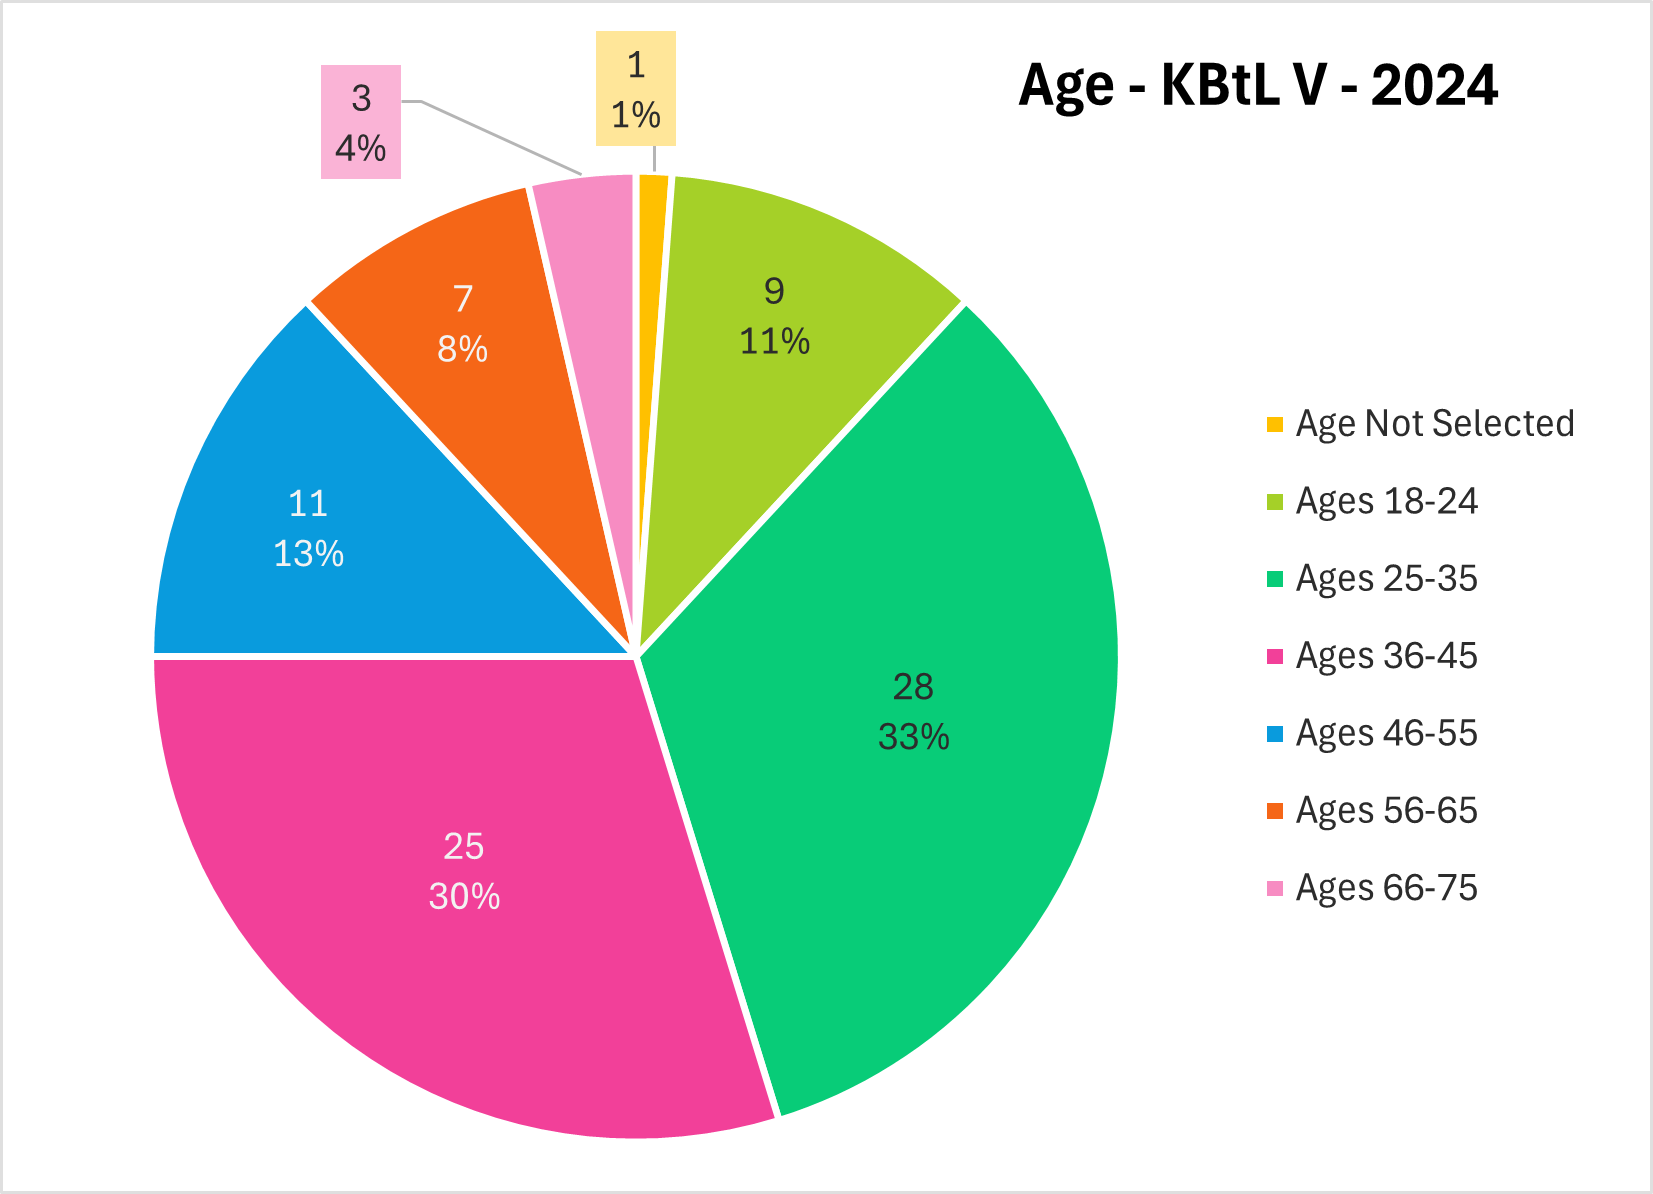
Ages
A pie chart of age ranges represented.
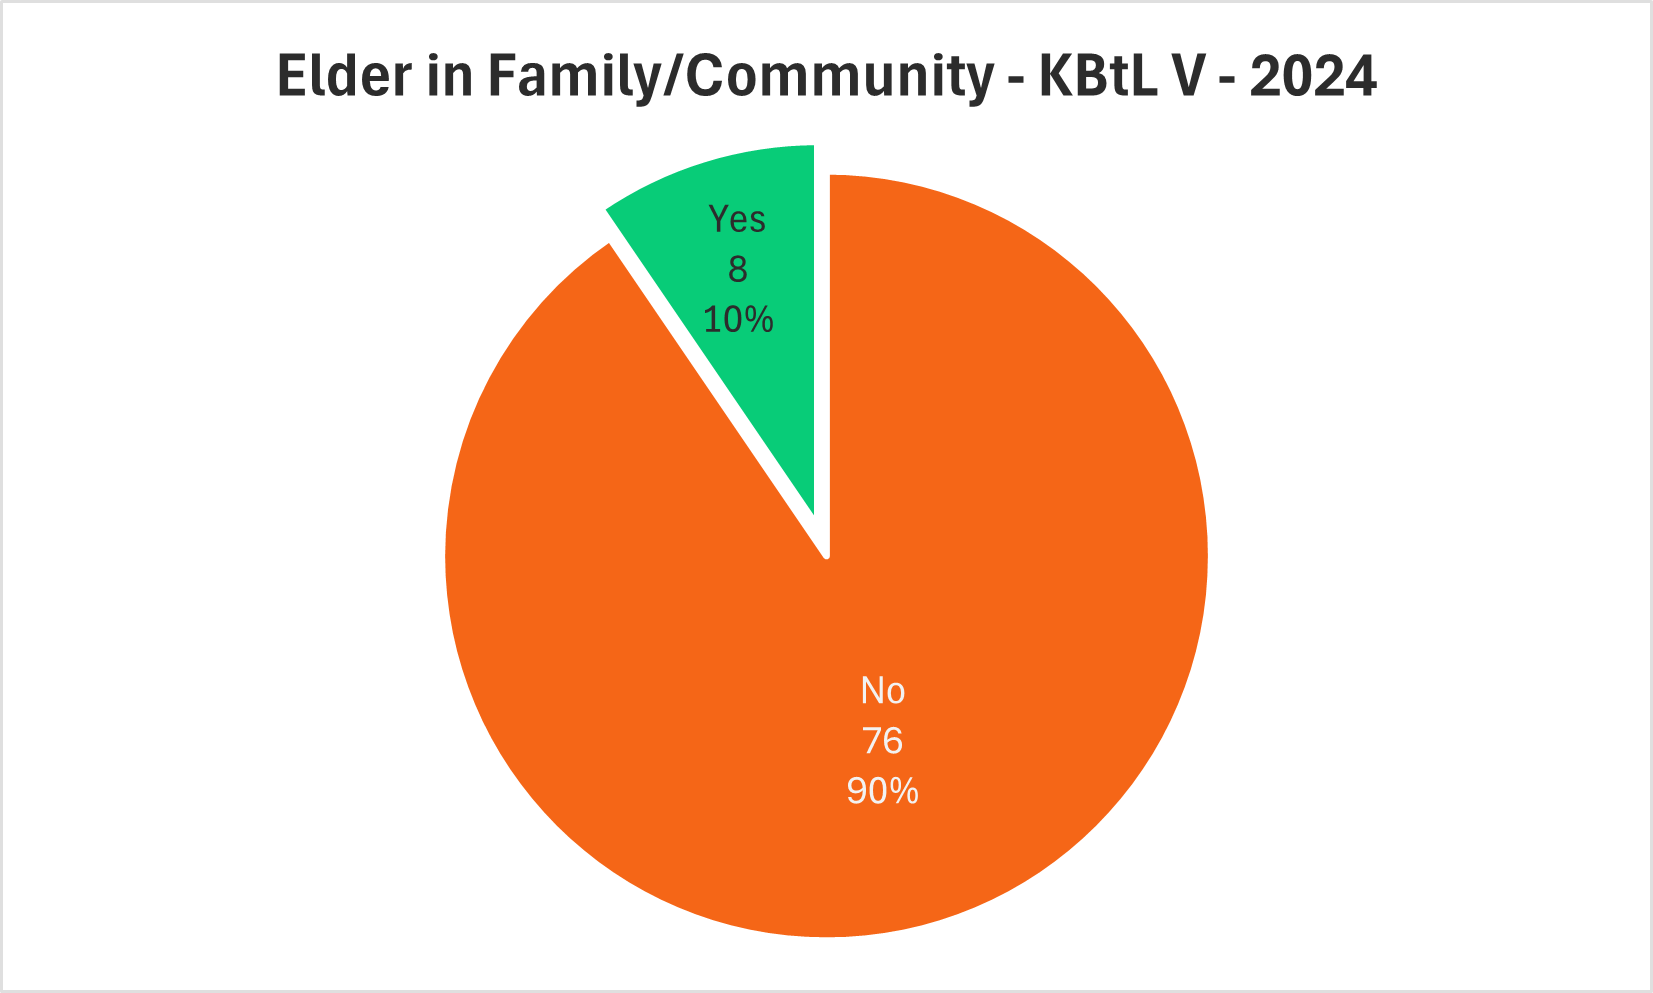
Elder Identification
A pie chart depicting how many people self identified as elders in their family or community.
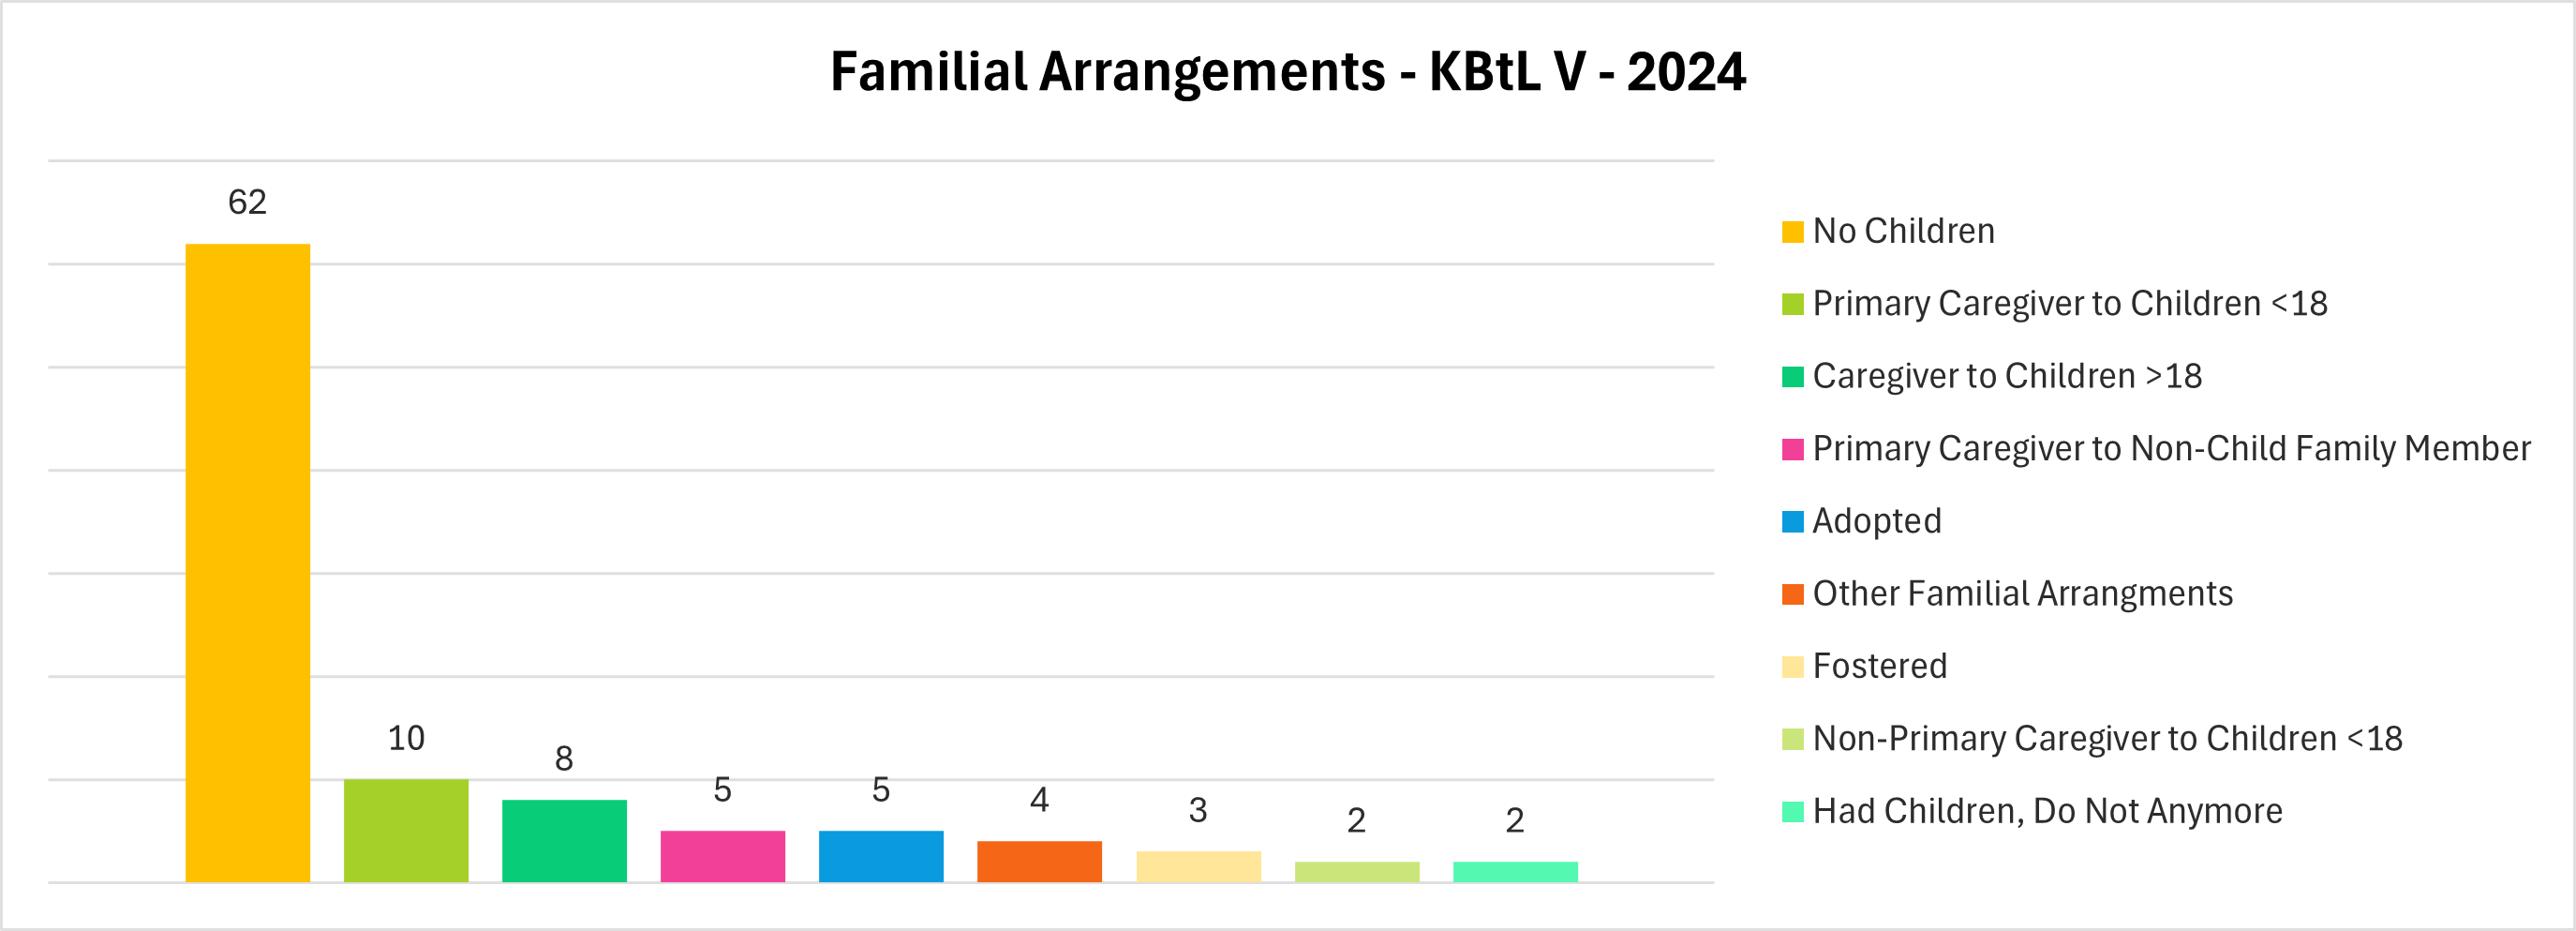
Familial Identities
A bar chart of family arrangements and caregiver identities.
Gender & Sexuality Data
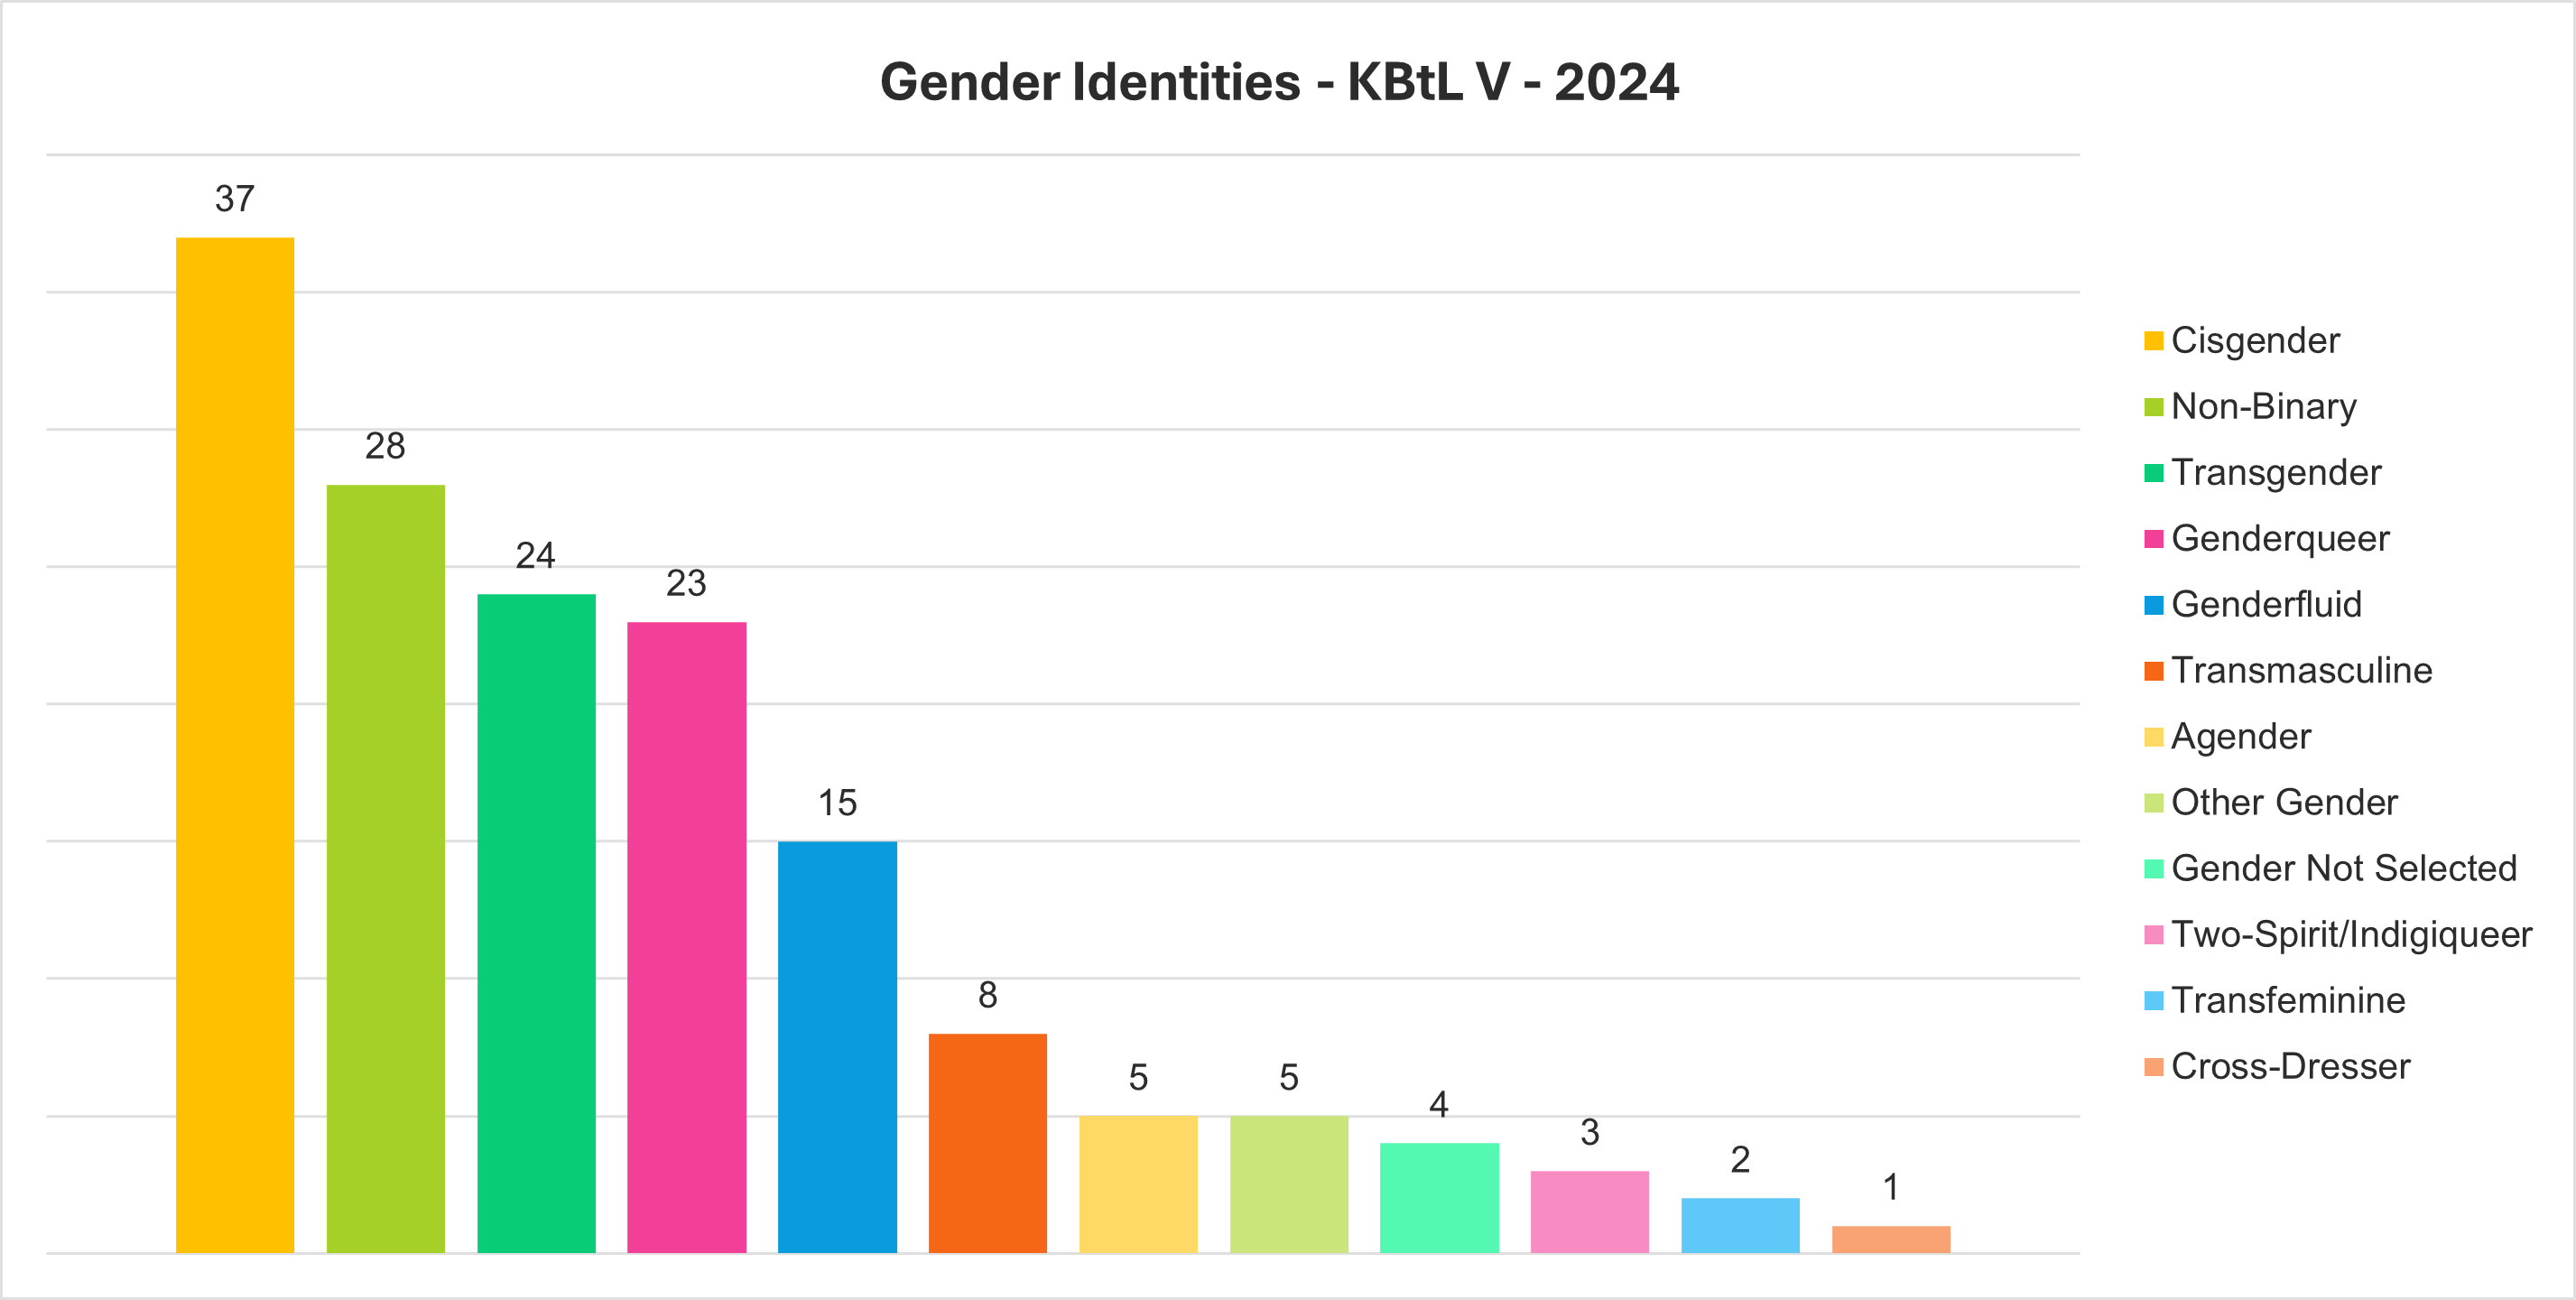
Gender Identities
A bar chart of gender identities people self-identified as. People typically selected more than one gender identity.
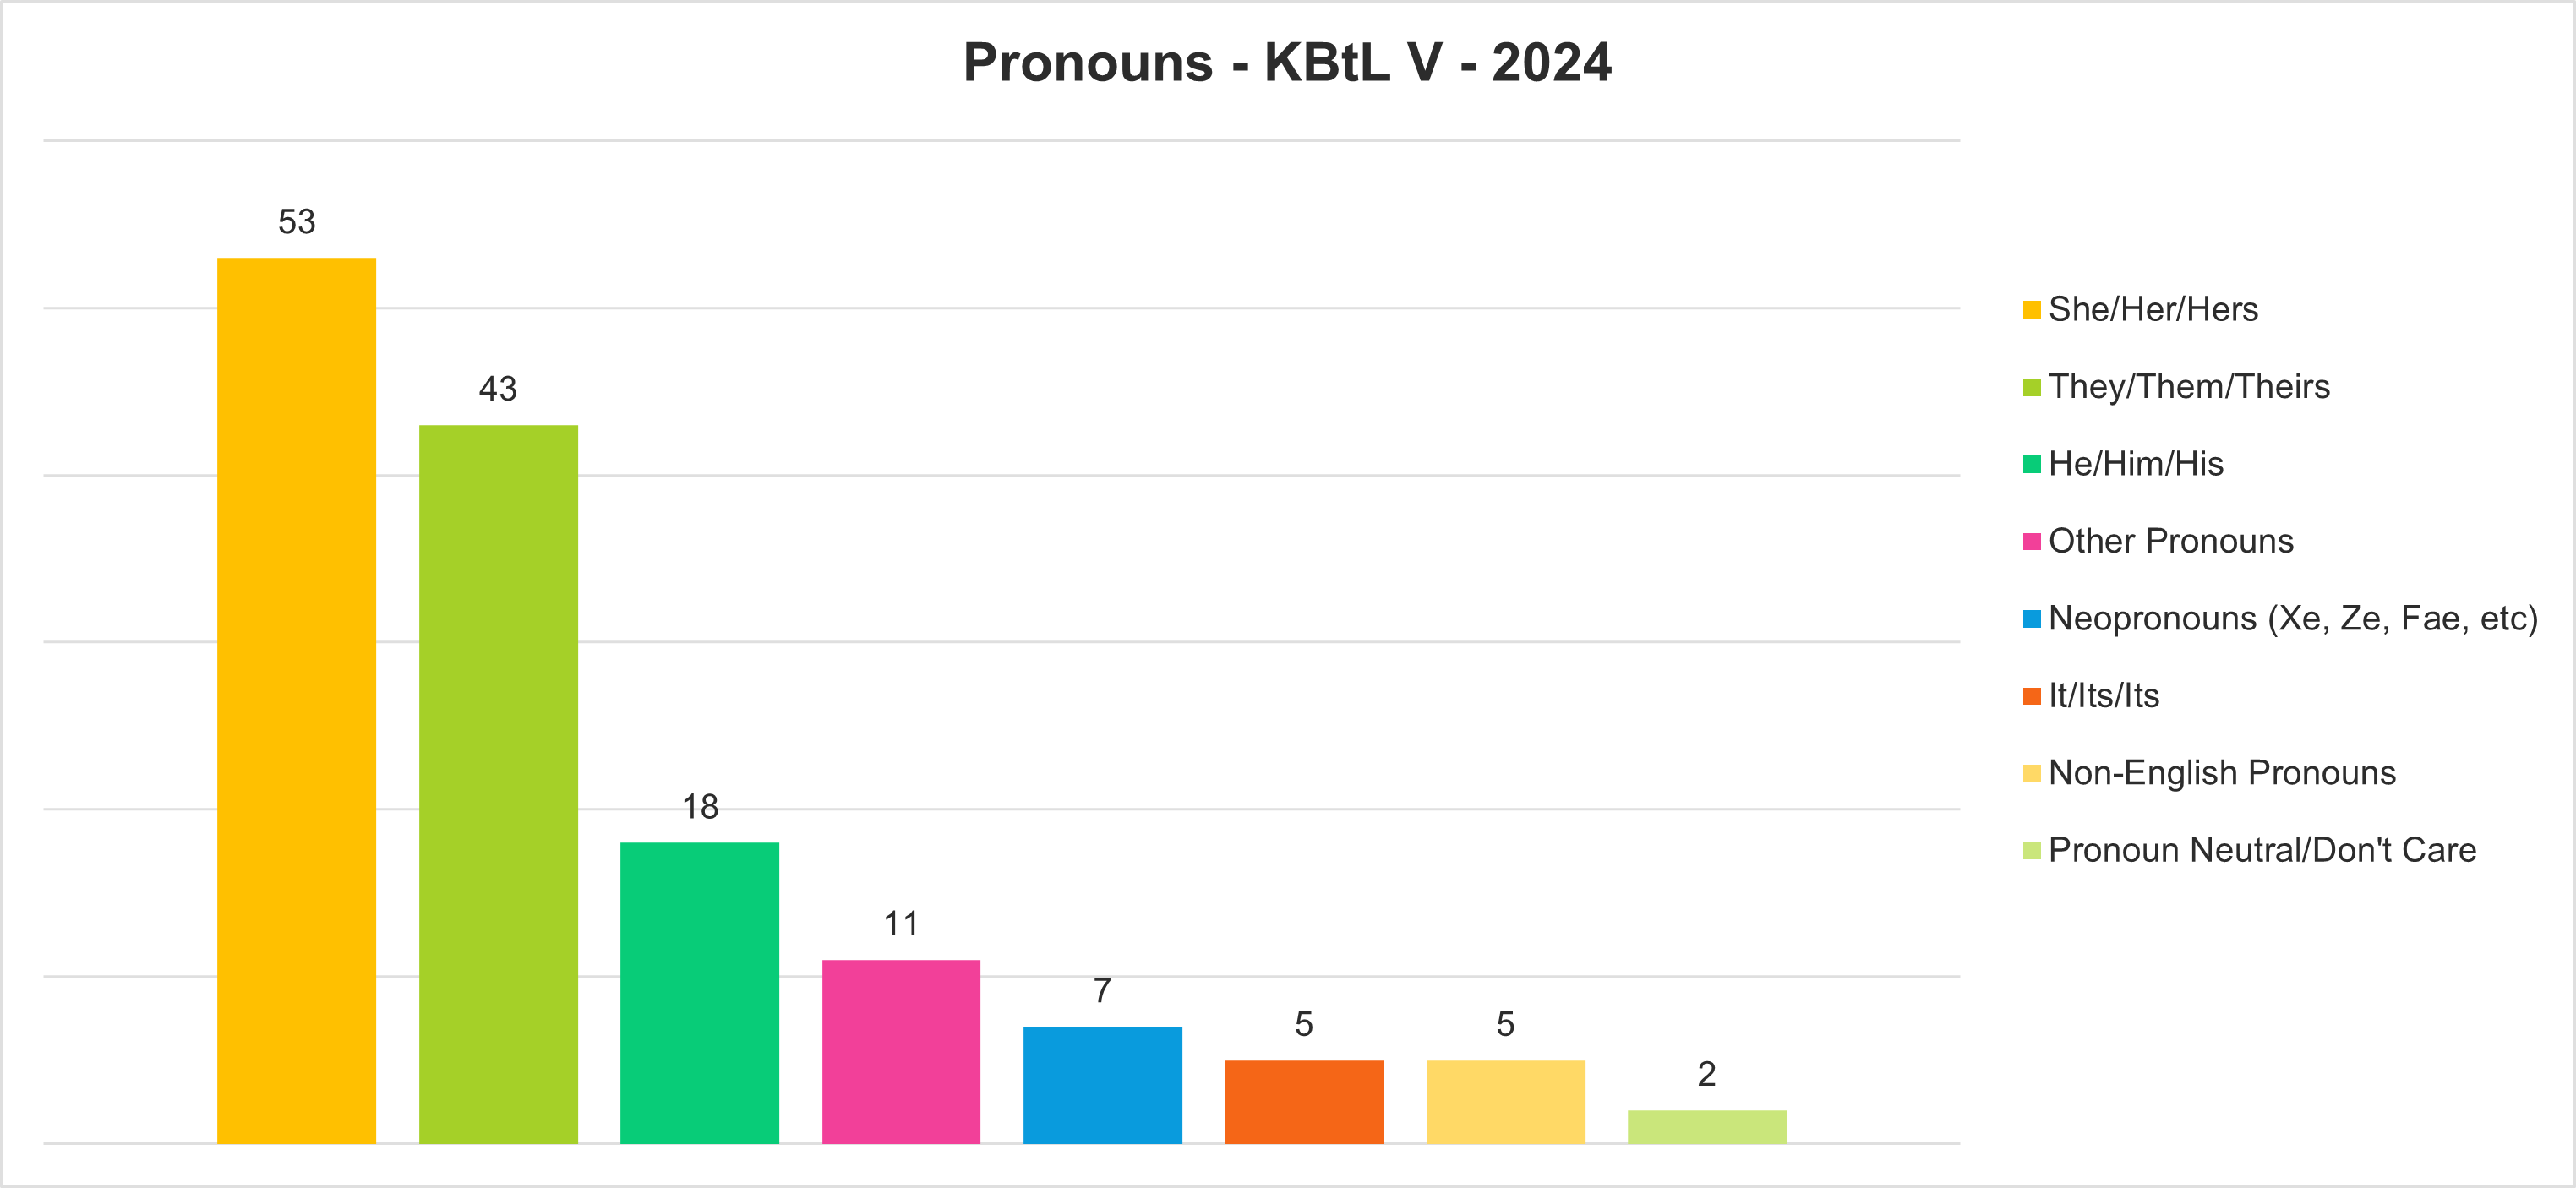
Pronouns Used
A bar chart of pronouns people listed. People sometimes select more than one pronoun.
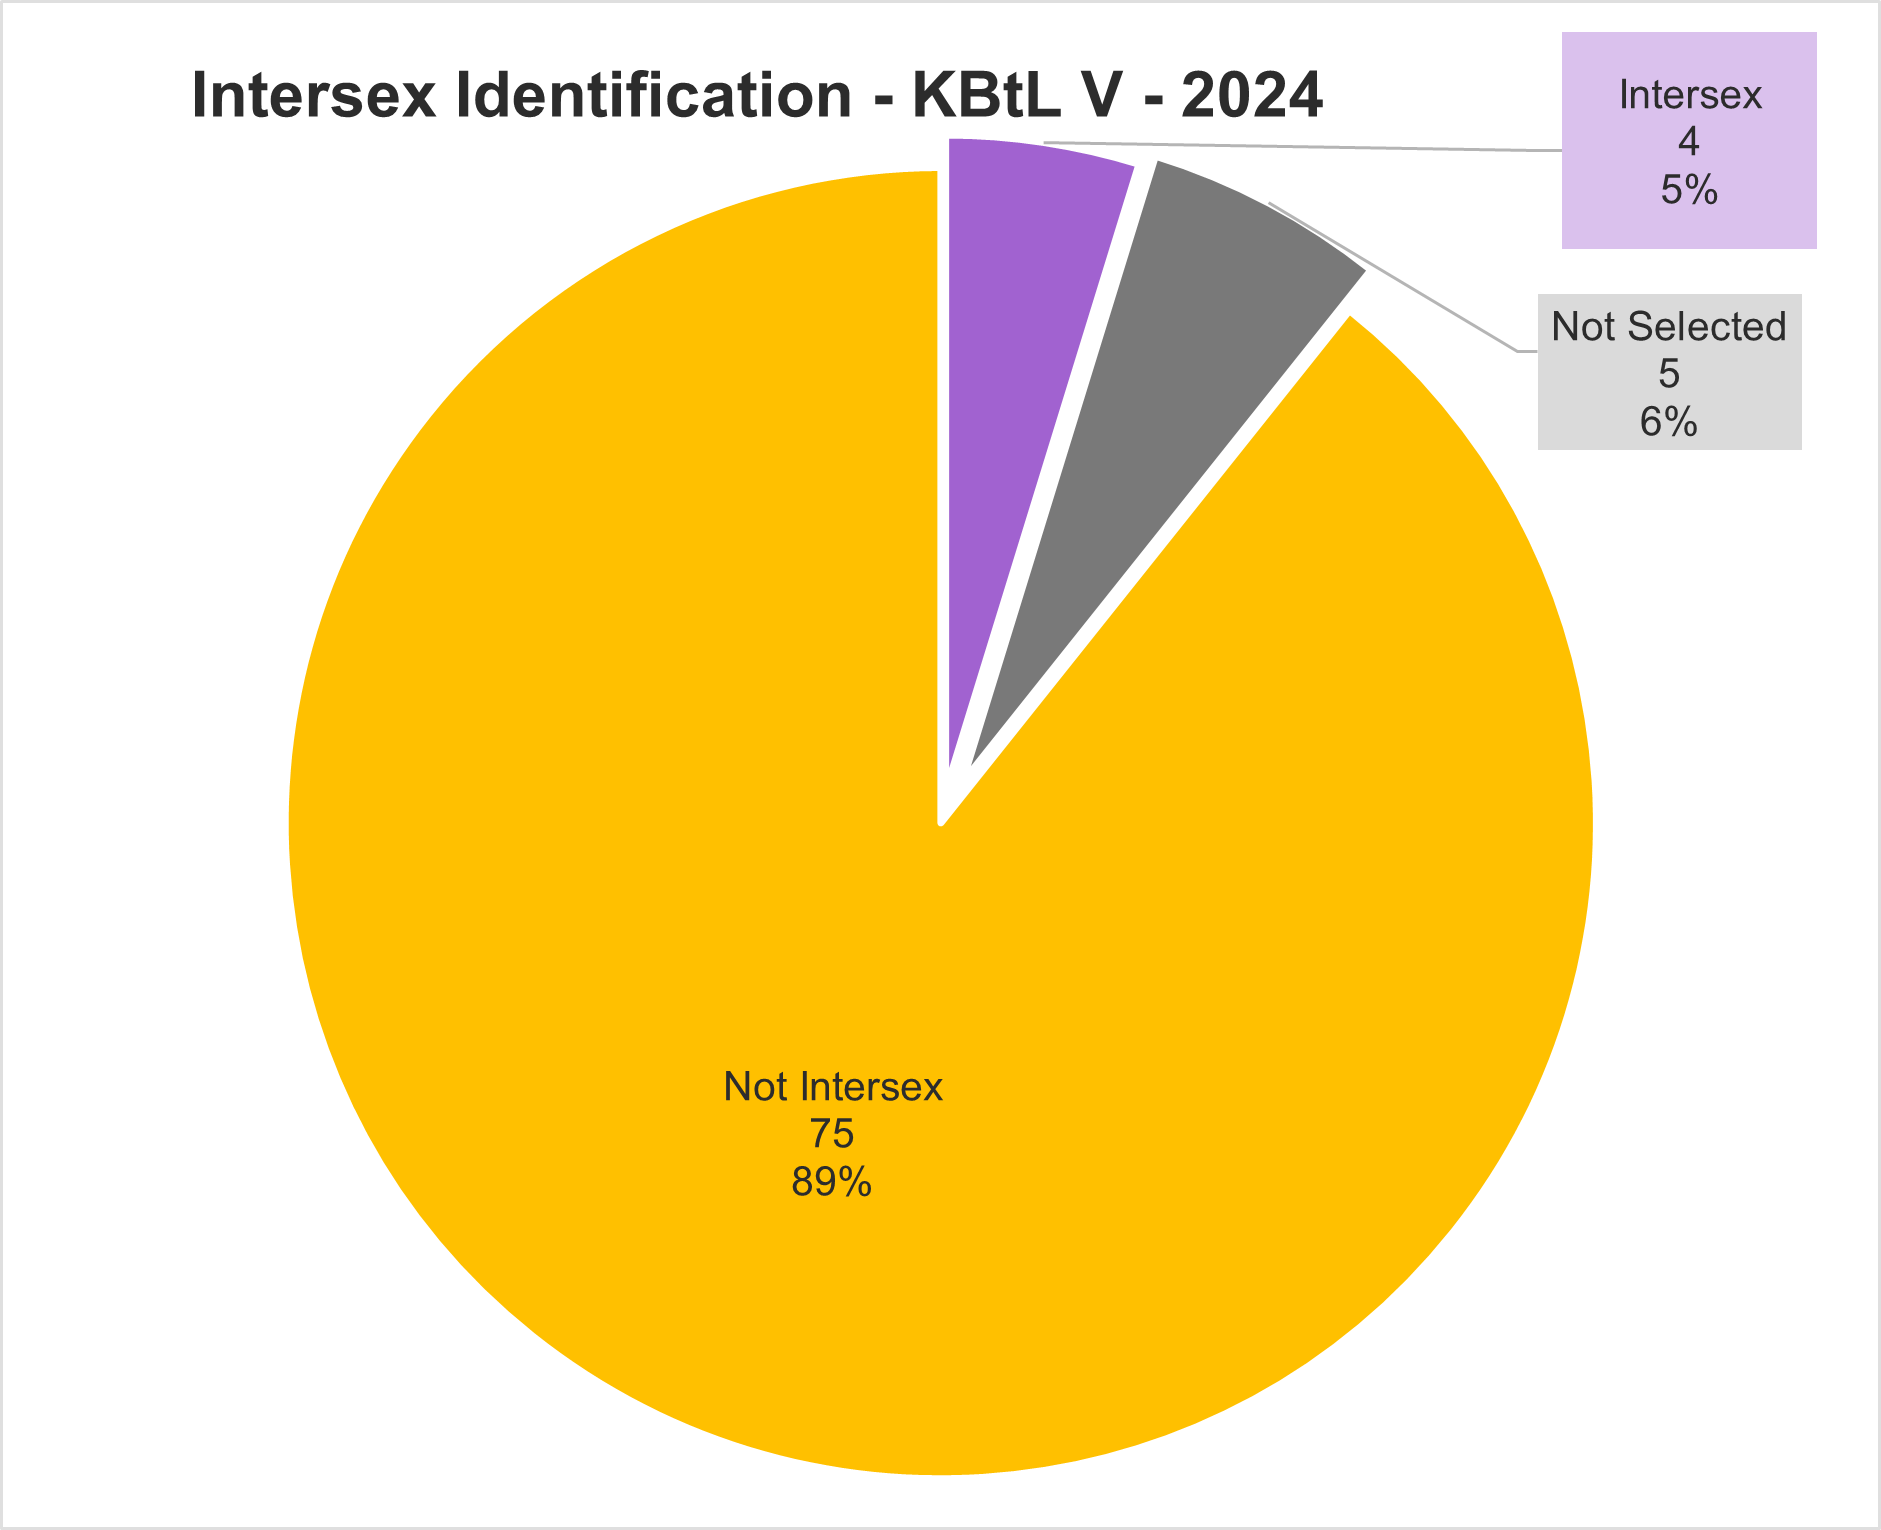
Intersex Identification
Pie chart of whether or not people self-identified as intersex.
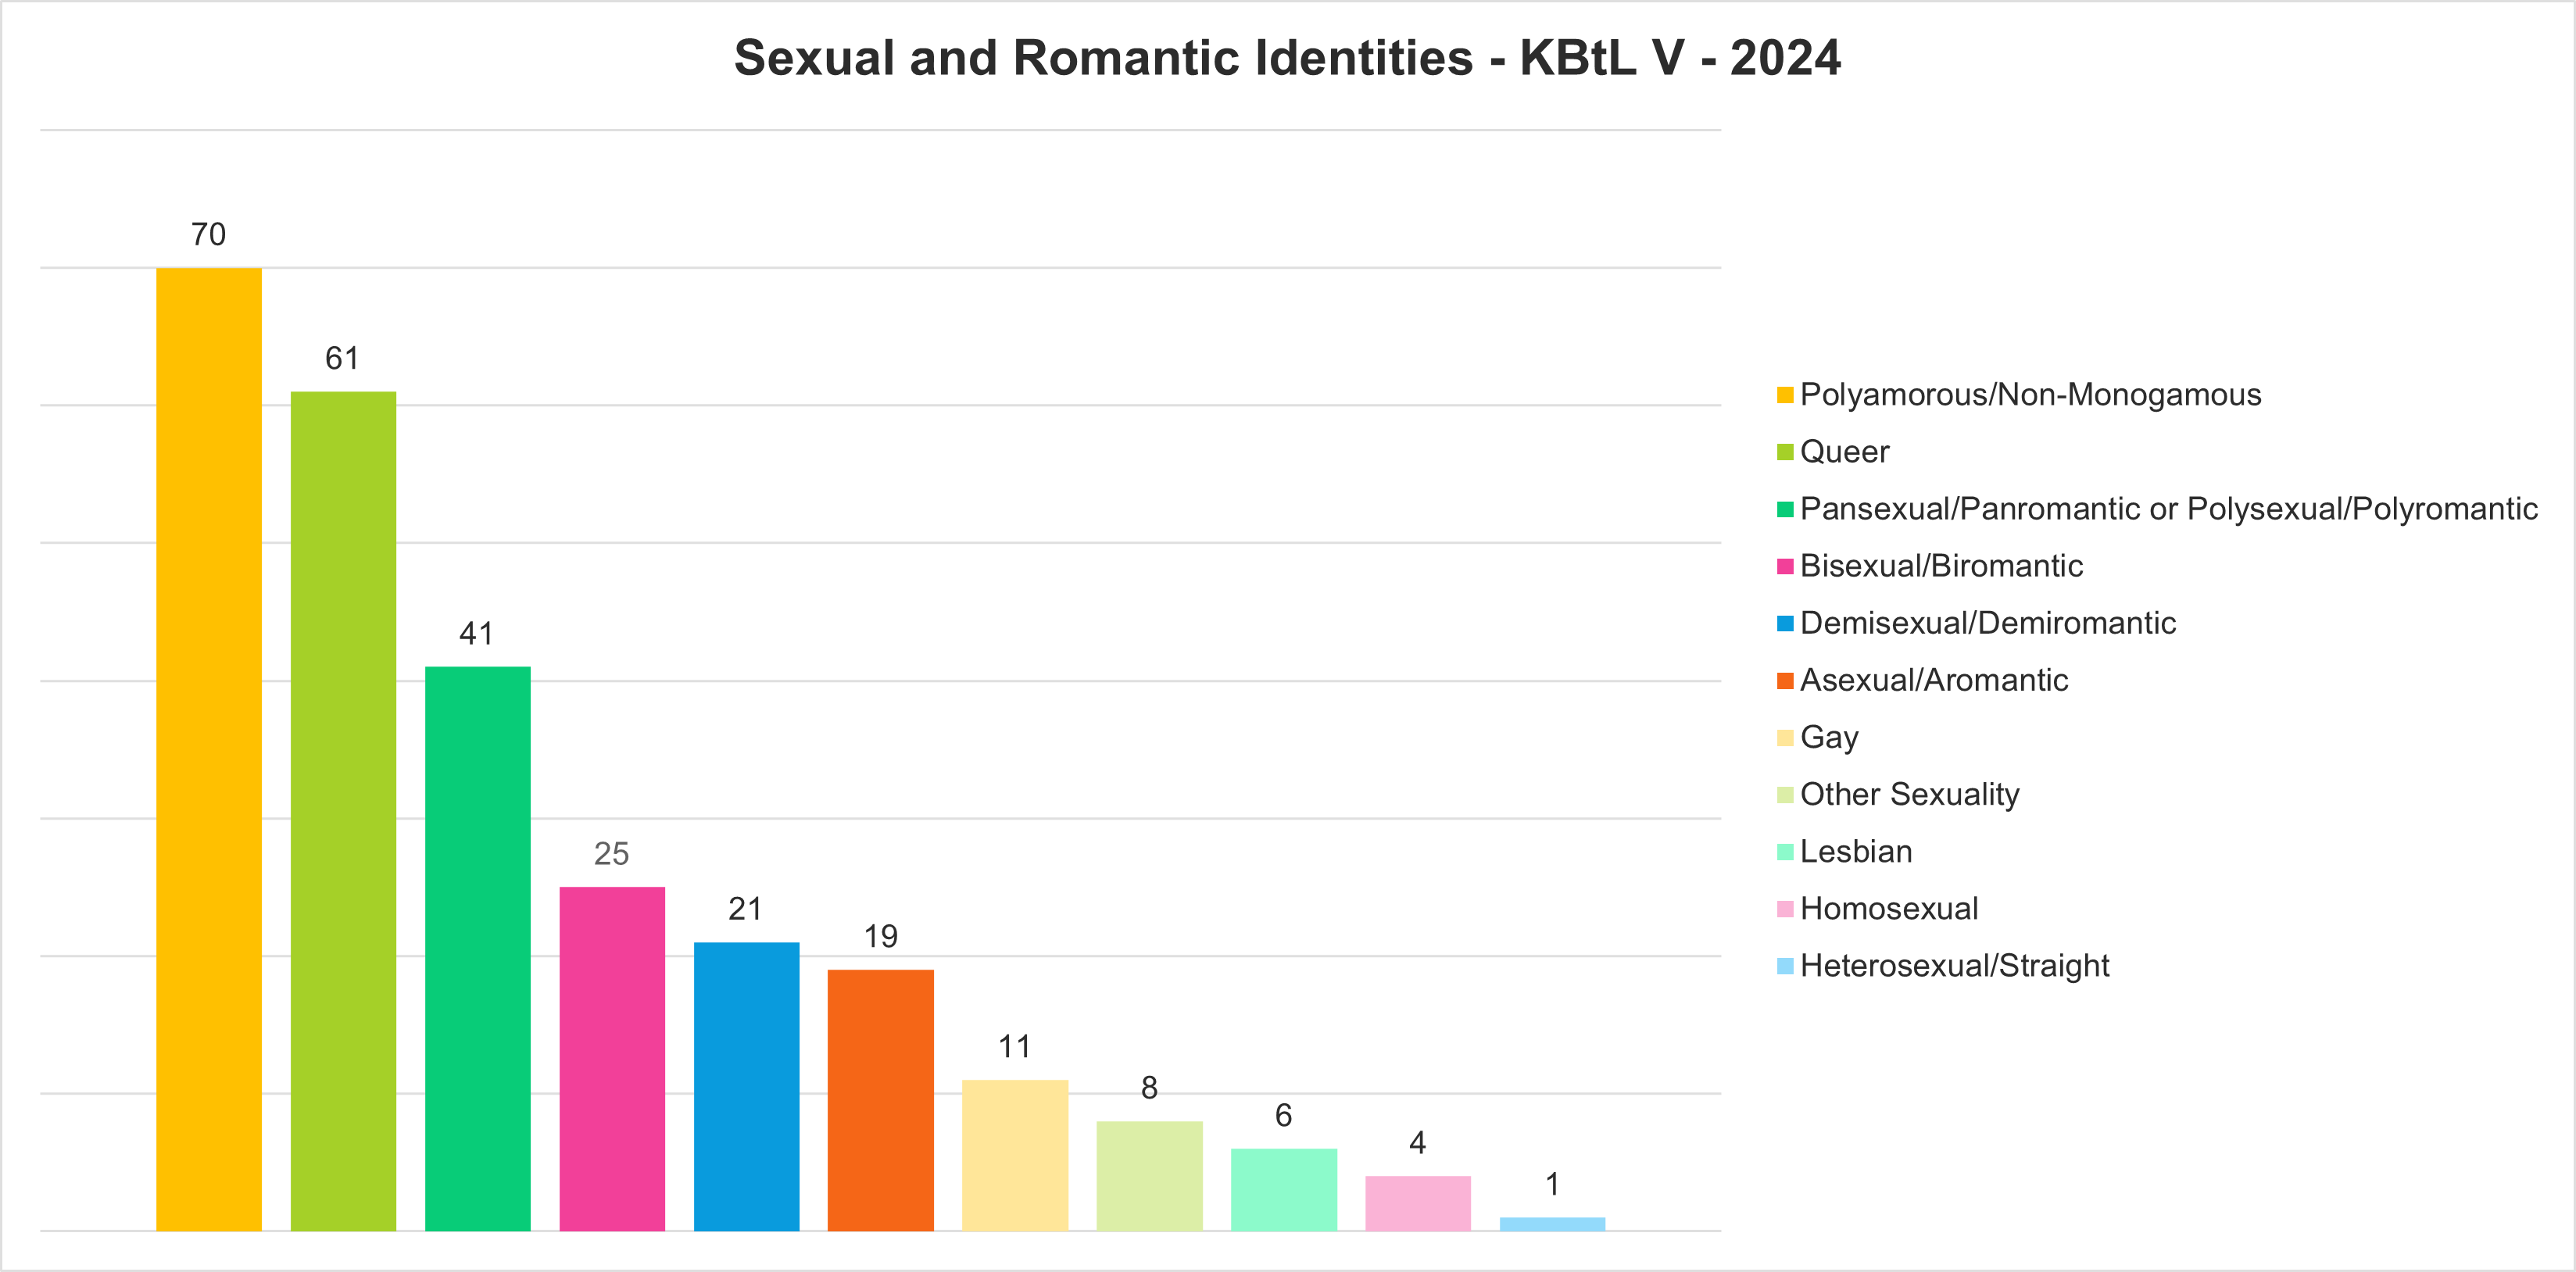
Sexuality Identities
A bar chart of sexualities people self-identified as. People typically selected more than one sexuality.
Disability & Societal Data
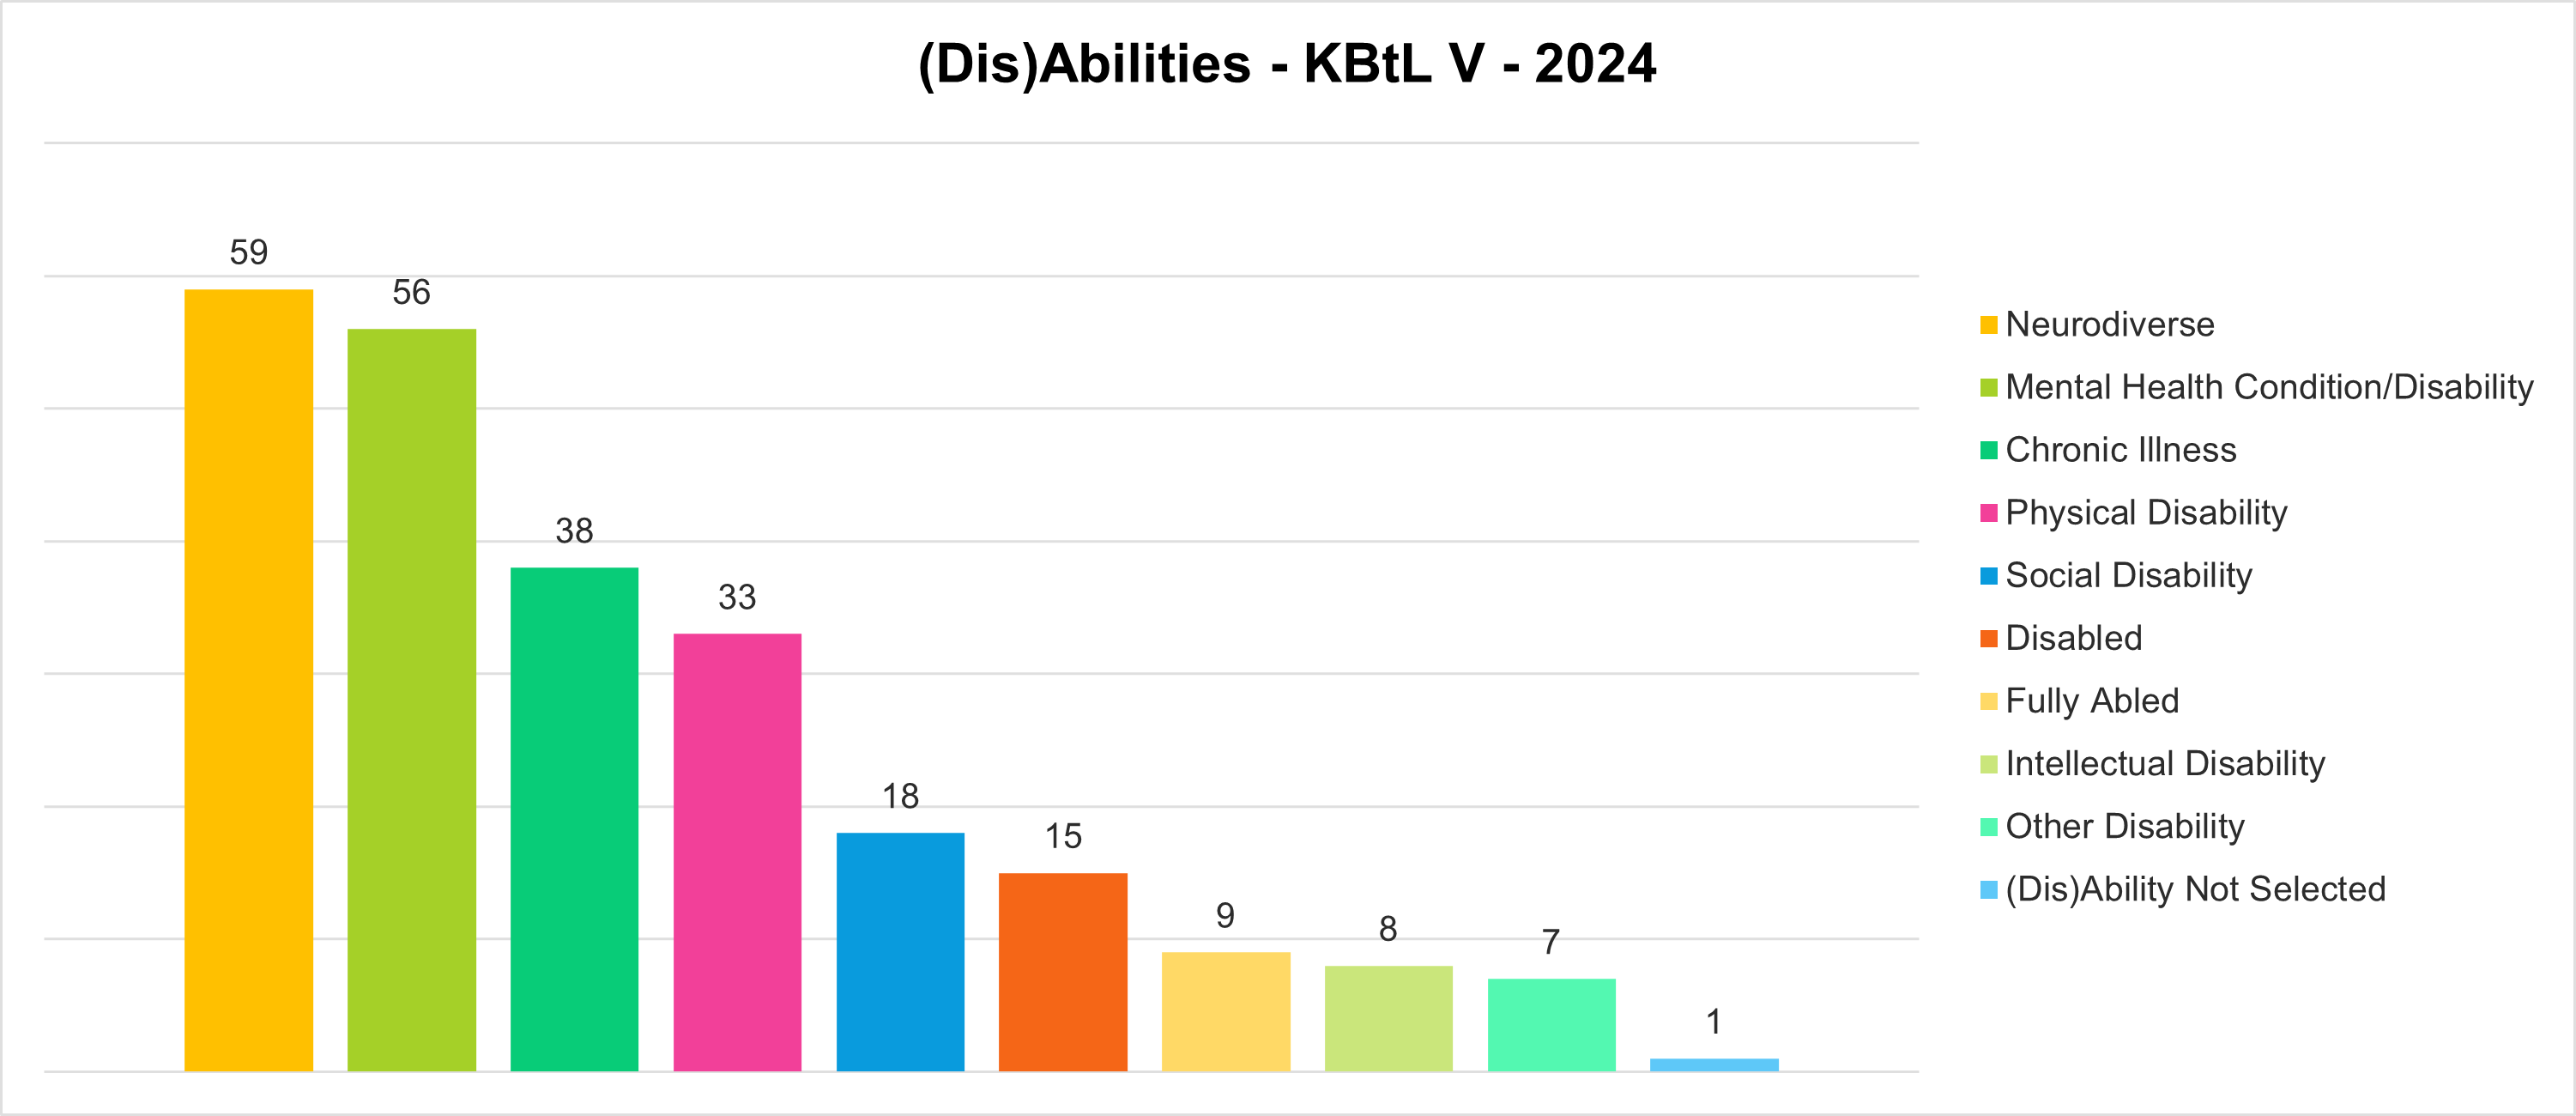
(Dis)Ability Identities
A chart of the realms of ability or disability that people self-identified with. Some people selected more than one.
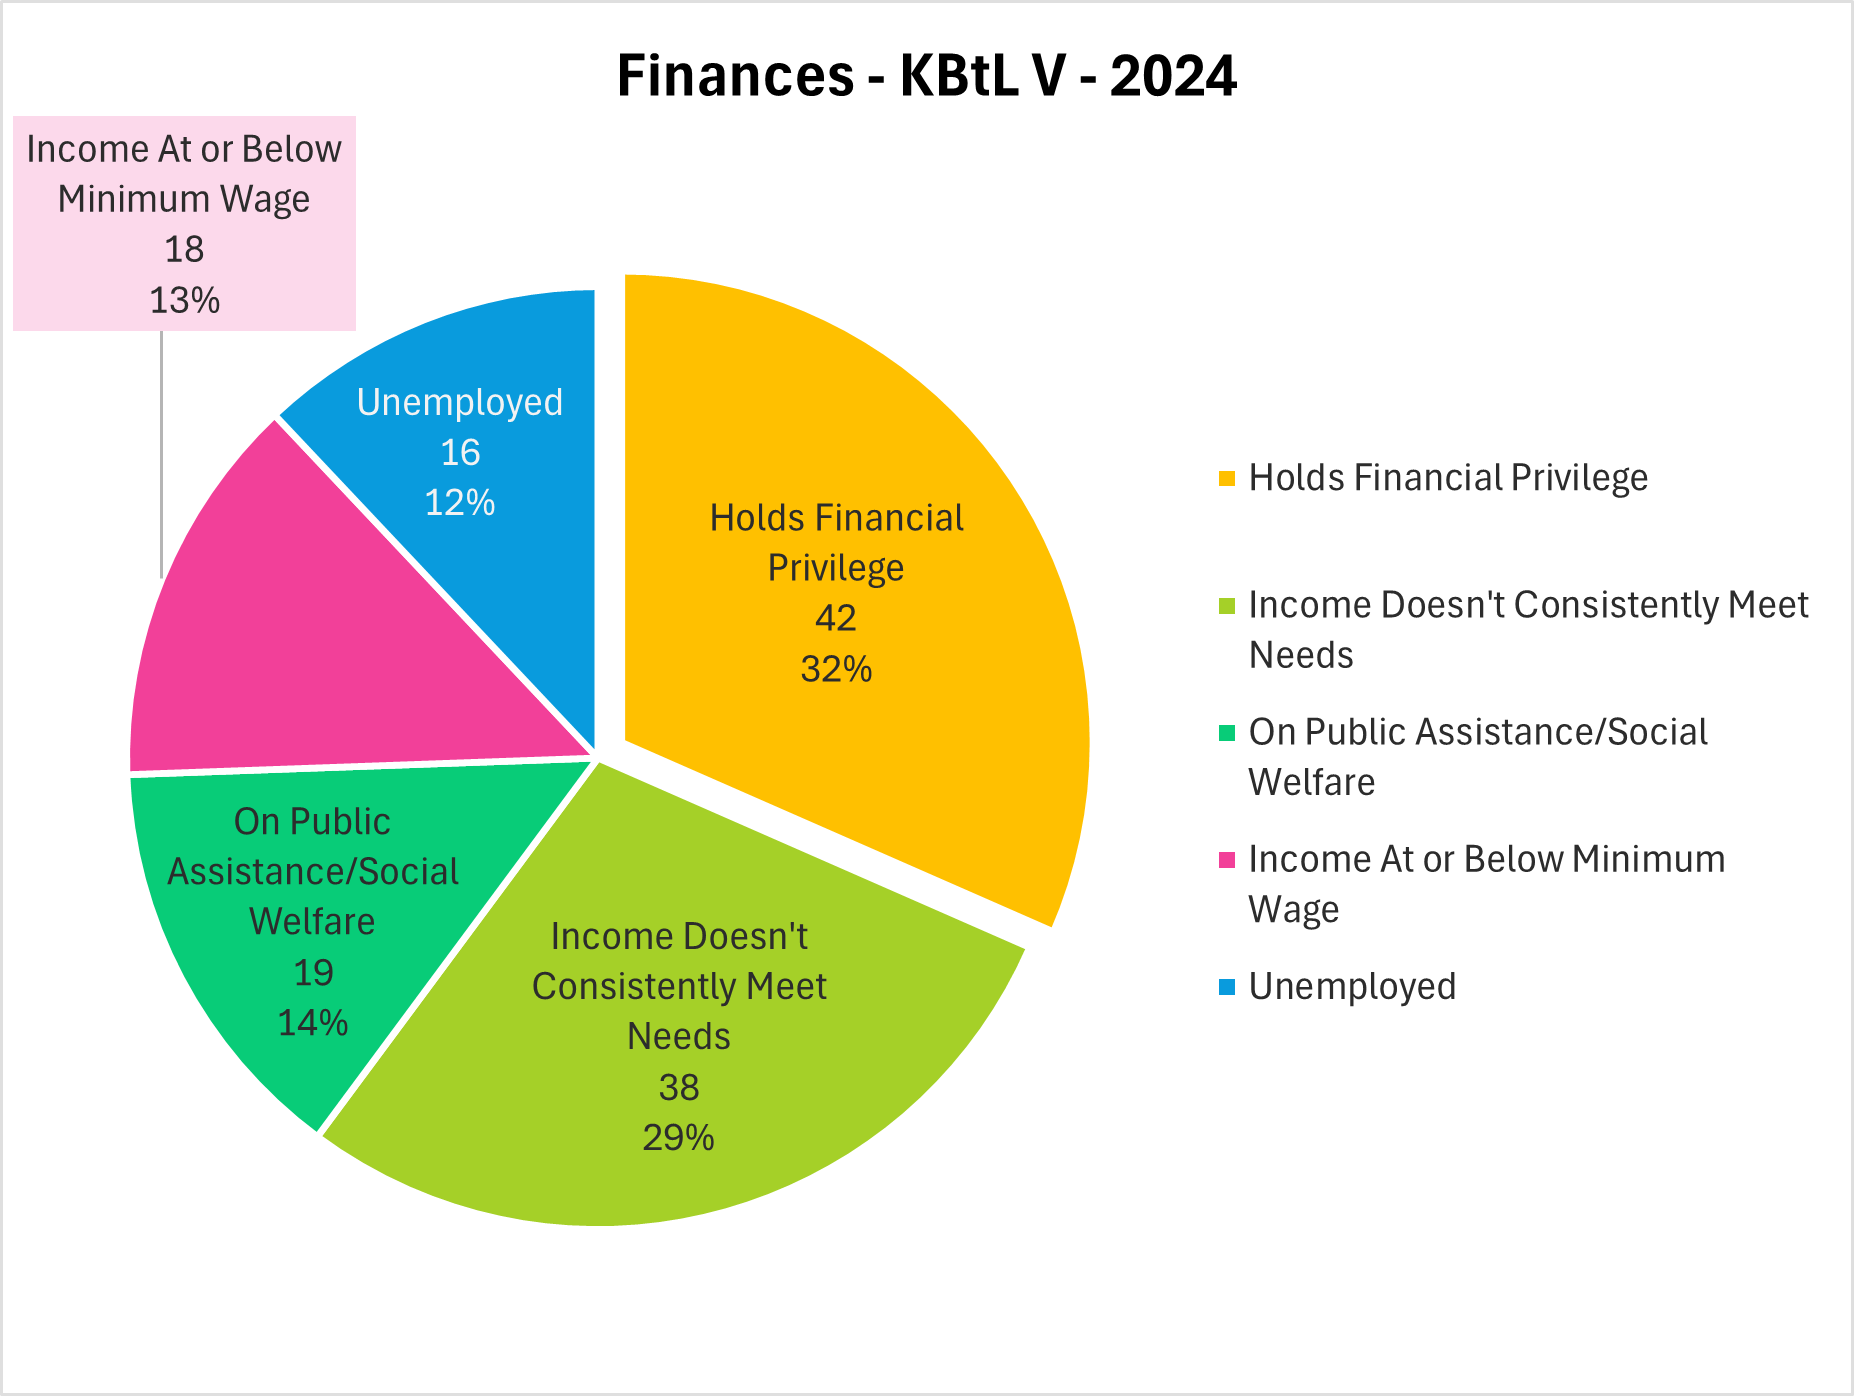
Financial Marginalization
A chart of the financial statuses that people identified with. Some people selected more than one.
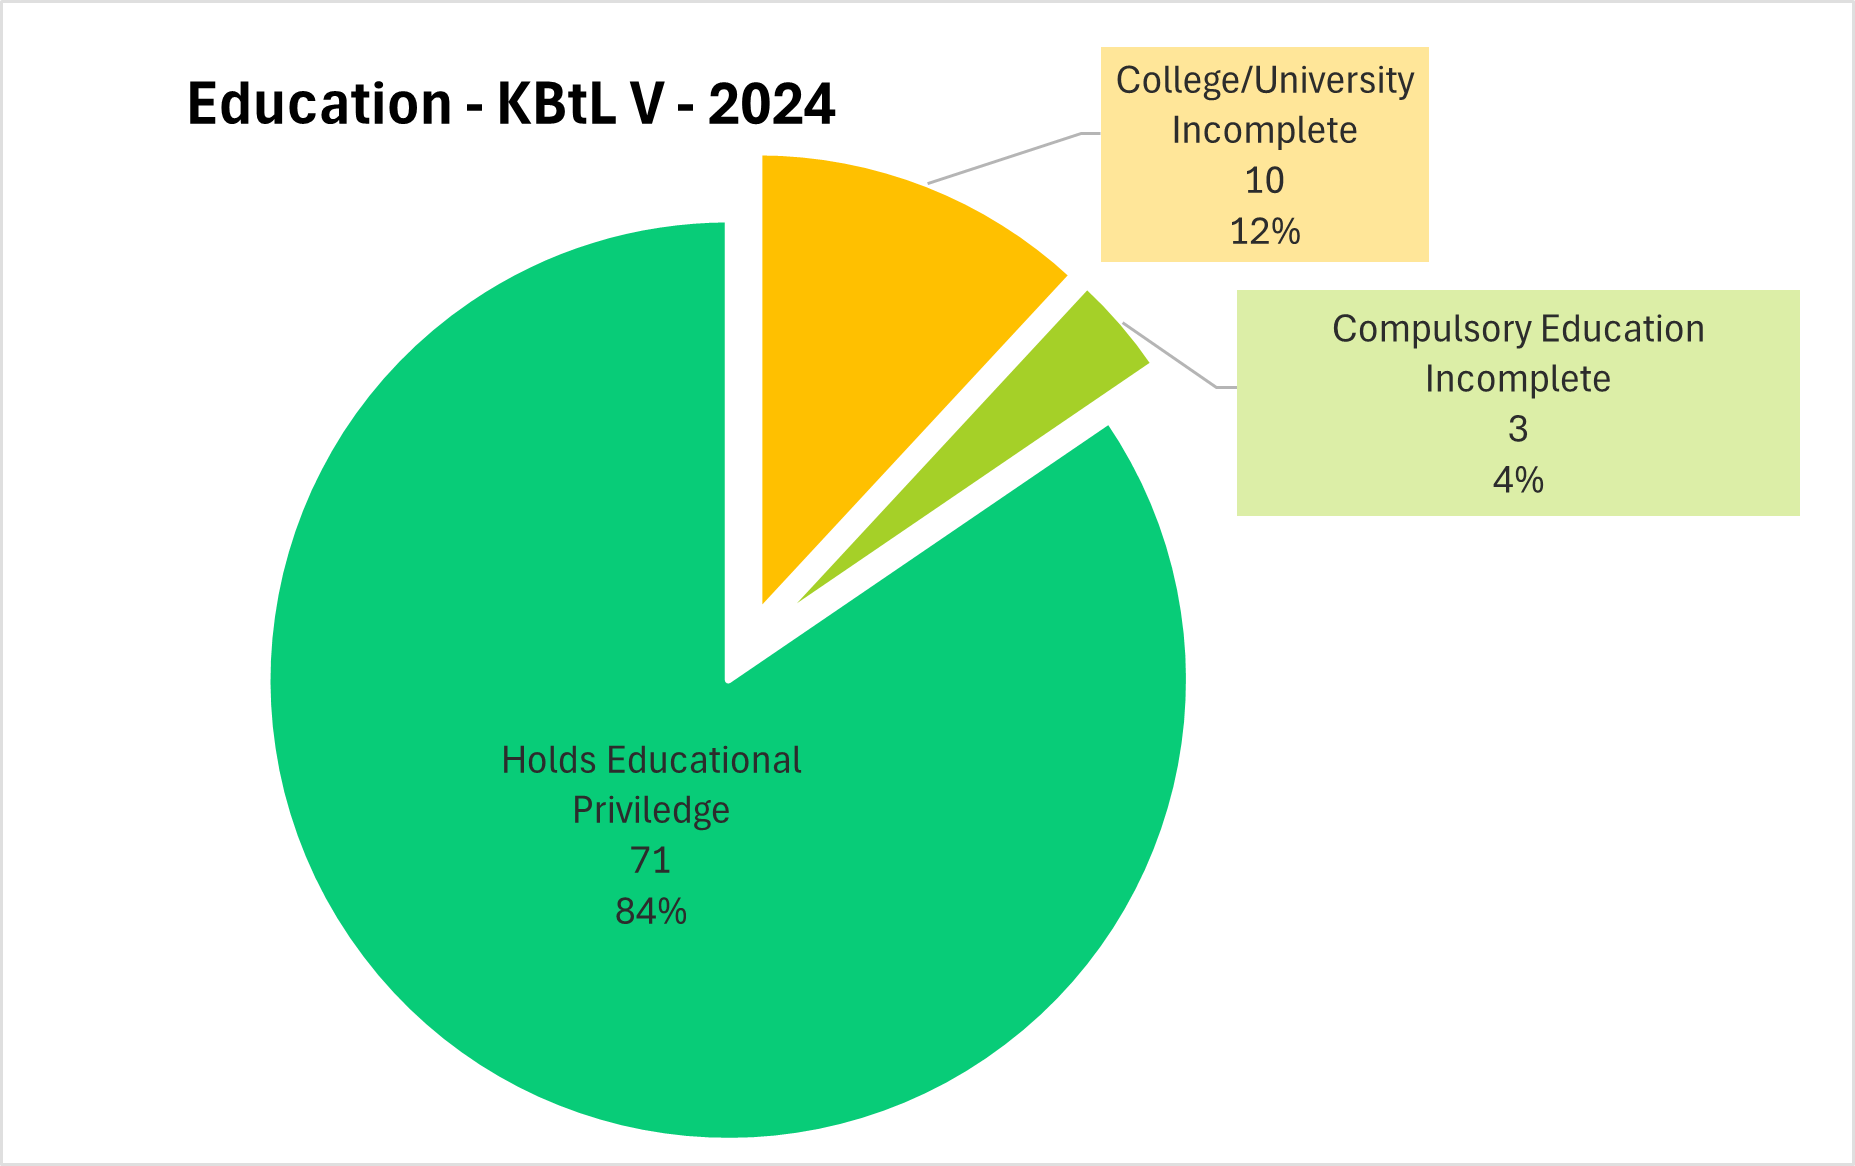
Educational Marginalization
A chart of the educational status of people.
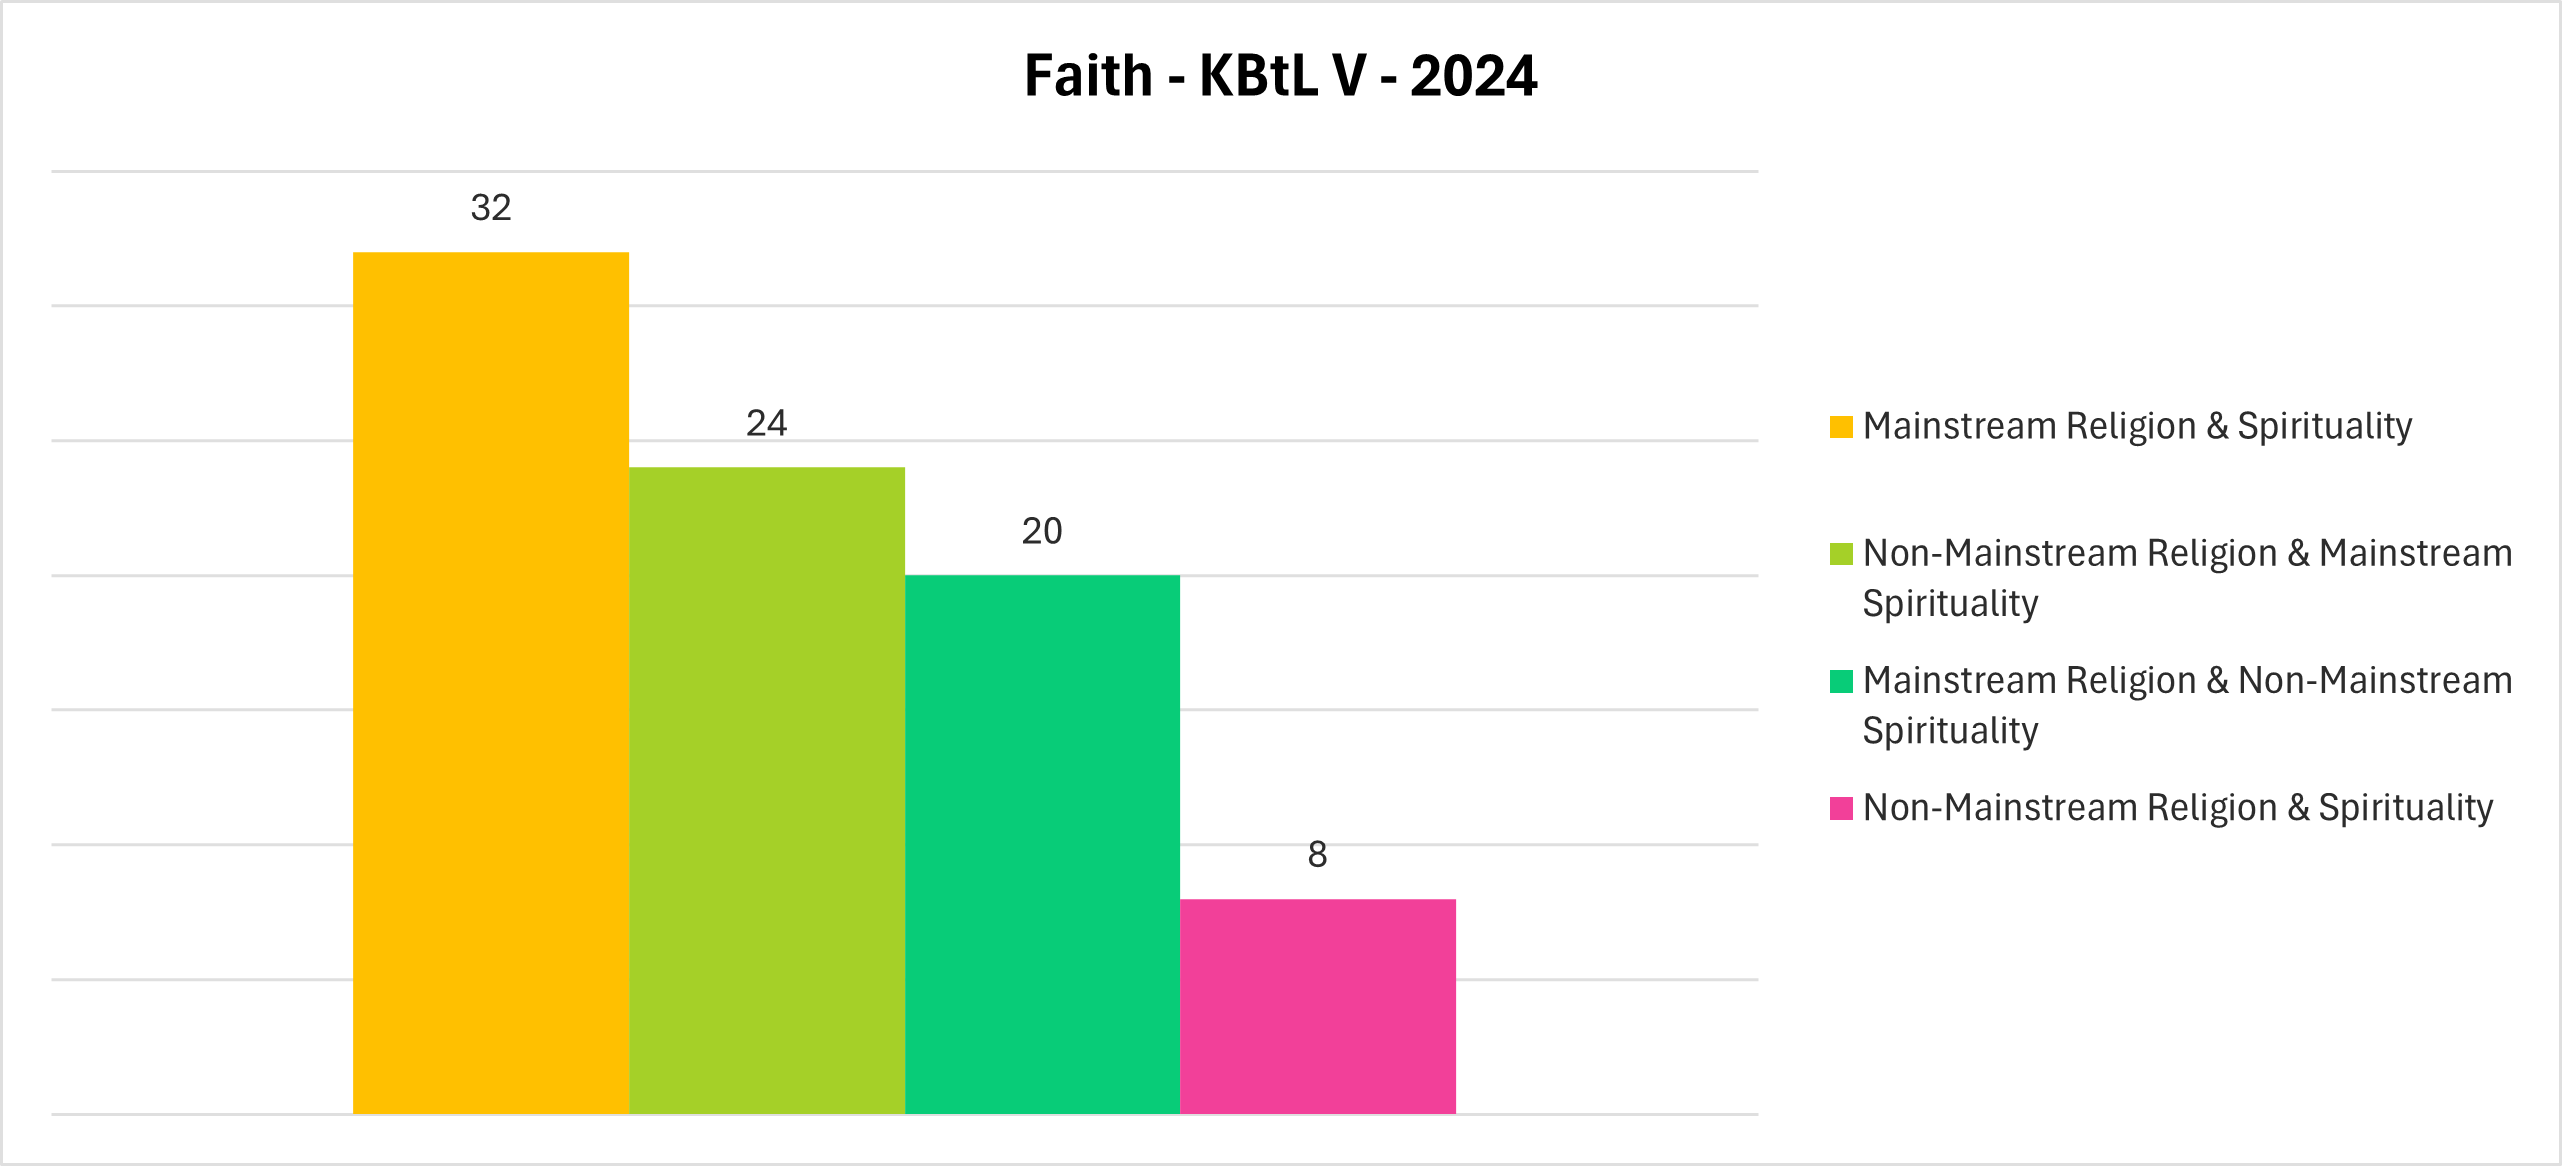
Faith & Spirituality Marginalization
A bar chart displaying how many people identified as having non-mainstream religions, spiritualities, both, or neither.
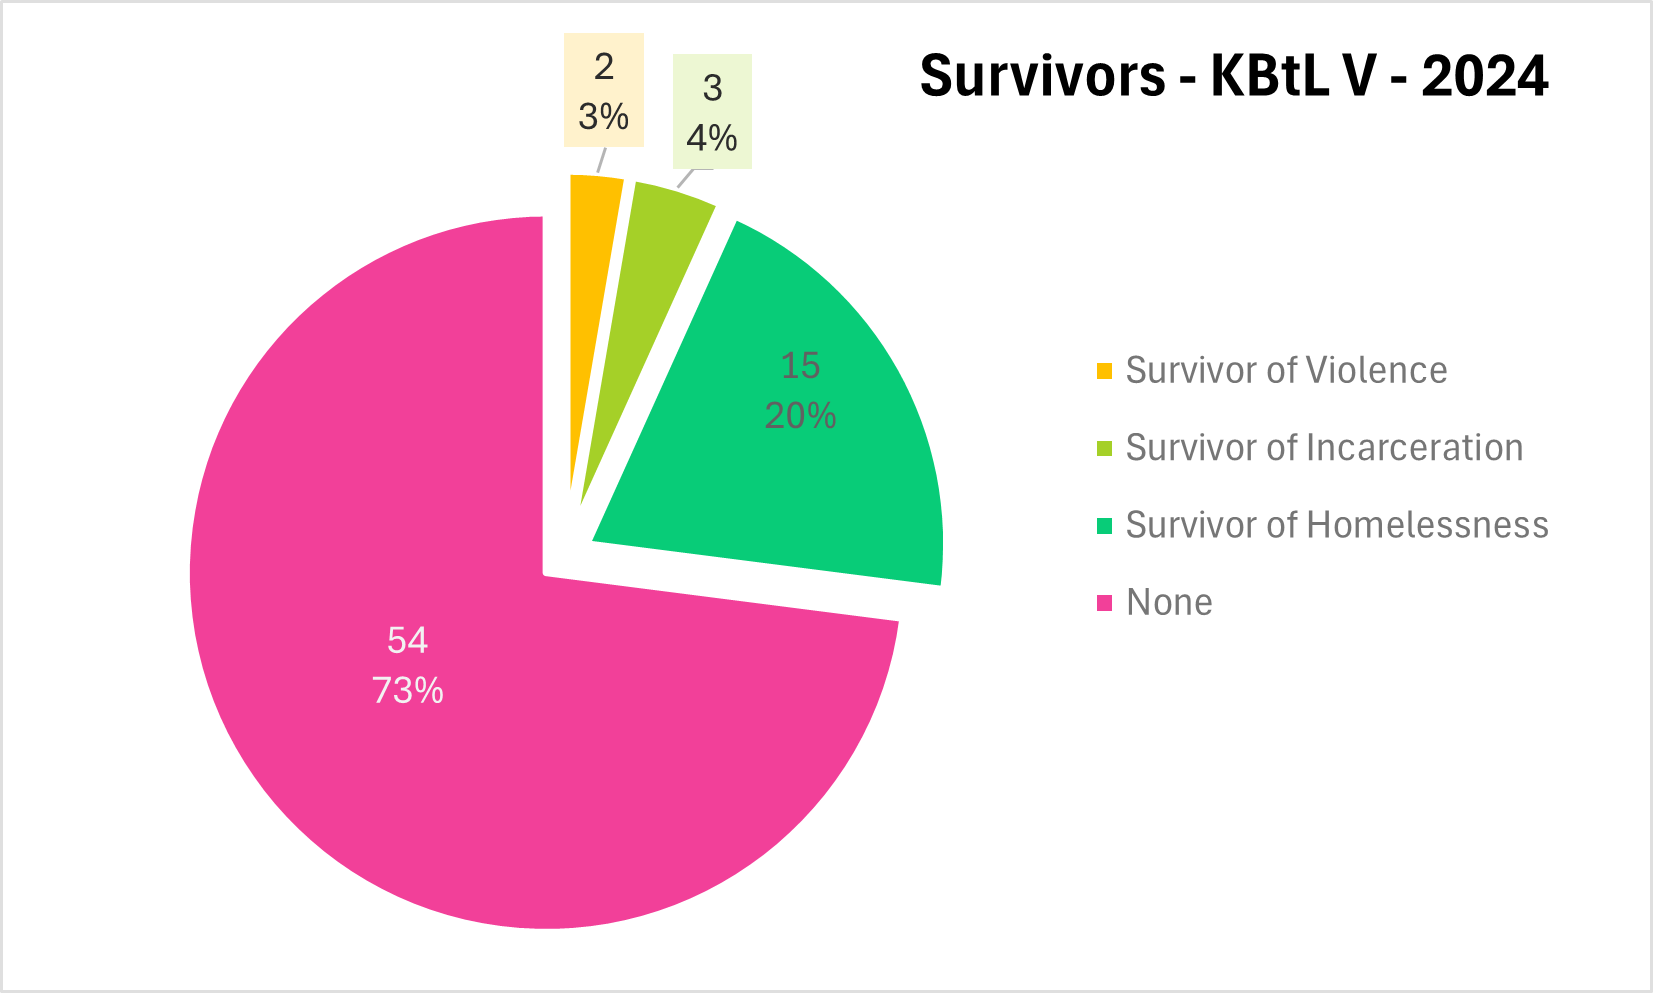
Survivor Experiences
A pie chart describing people’s experience with trauma and being a survivor.
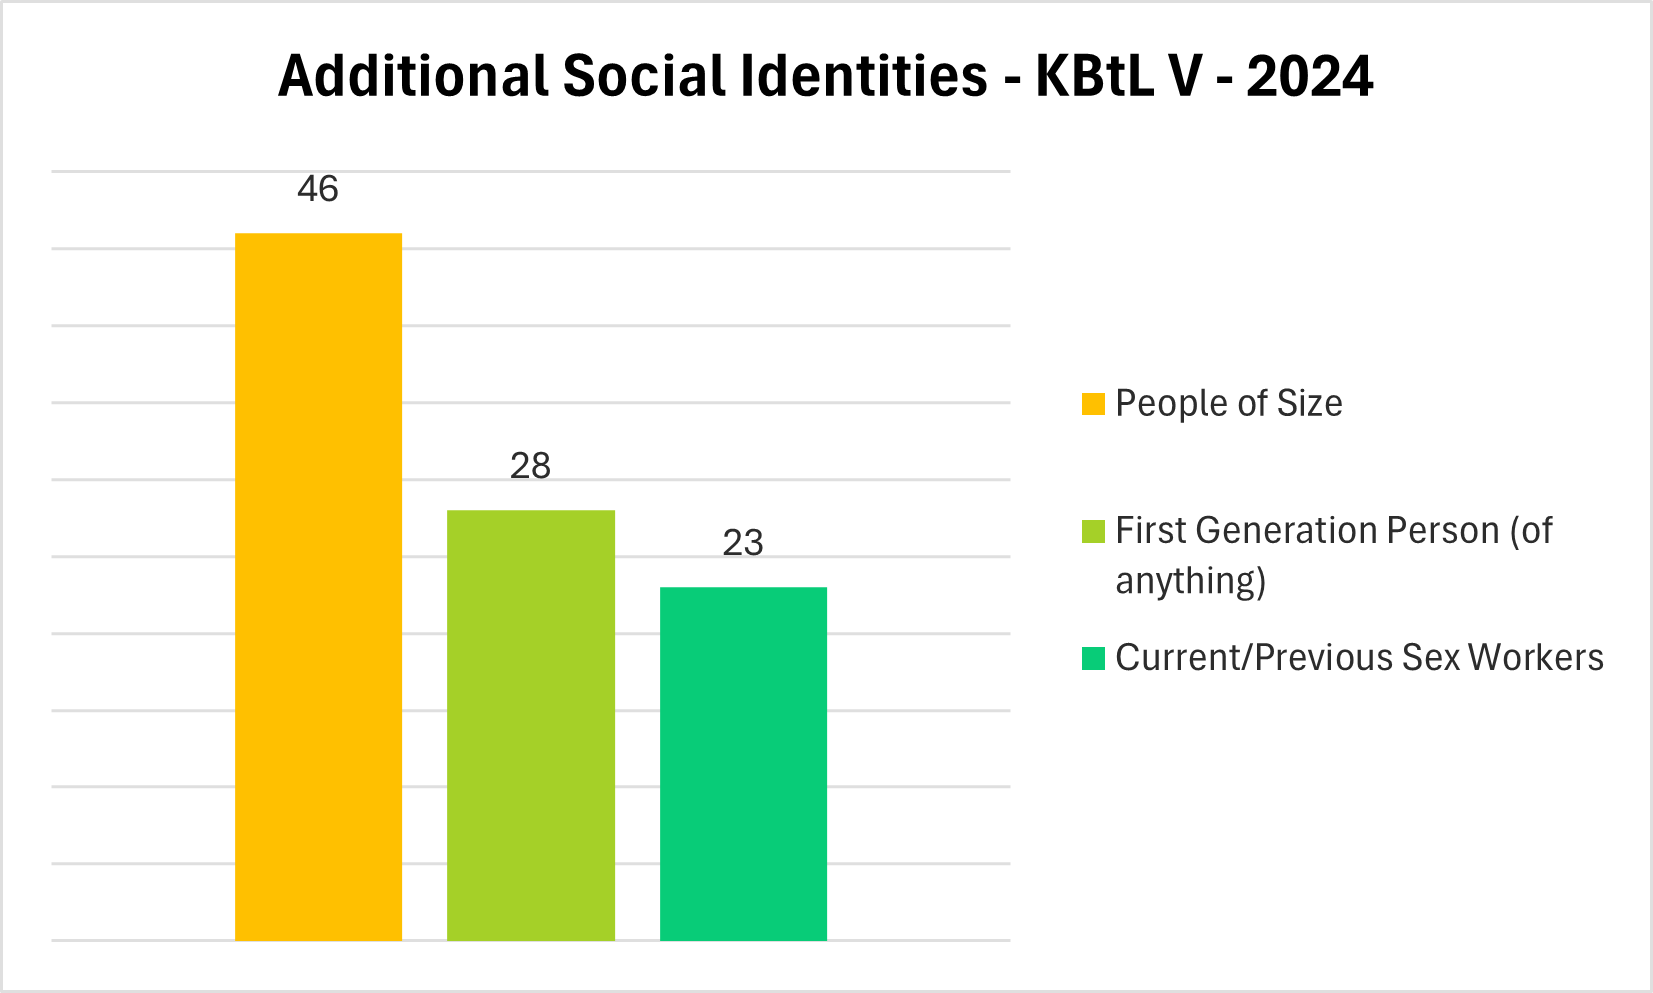
Additional Social Identities
A chart of additional social identities people self-identified with including being of size, a sex worker, or first generation.
Who are we missing?
All data is biased in some way and data can show us a picture, but it is often not a complete picture with all the nuances of real life. It’s important to recognize who is missing from our demographic data too.
Participation
Unfortunately, not every attendee fills out a demographic form. We cannot and do not force attendees to fill out demographics, but we prominently request it of them several times in emails and during the event. There might be many reasons people don’t fill it out: time, lack of technology access, spoons, frustration with the questions, apathy, fatigue with the length of the form, because they wish to remain private, forgetfulness, lack of accessibility, and more.
Consent
We ask people filling out our demographic form to answer three consent questions about how we use their data. The first question is mandatory and asks if we can use their data for internal use, which means we can use that data as an organization to understand our attendees better as well as use it within closed conference-only areas such as during a closing keynote or in Discord. The second and third questions are optional. They ask for permission to use their data for educational purposes and funding purposes. People can choose to say no to either of these purposes if they wish. Educational purposes allows us to display the data on our website on this page and to use it if we produce classes, handouts, or other educational material. Funding purposes allows us to use the data if we apply for funding such as a grant. Only people who have consented to have their data used for educational purposes are displayed on this page.
Gaps in Questions
No matter what we do, there will always be some gaps in the way in which we ask questions or the way in which people interpret the questions we ask. We improve our demographic form every year to try to account for as many sources of marginalization as possible, but it’s impossible to include all of them. In addition, we may think we are being perfectly clear about a question but others may have different interpretations of our words. This has happened several times with our data over the past few years.